Fig. 2.

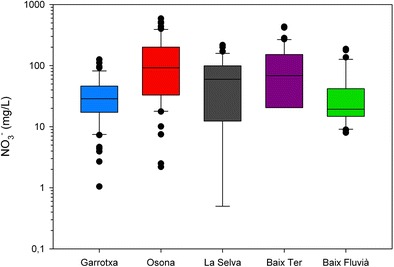
Box plot of the nitrate concentration distribution in each of the studied aquifer systems. Data from the diverse references cited within the text

Box plot of the nitrate concentration distribution in each of the studied aquifer systems. Data from the diverse references cited within the text