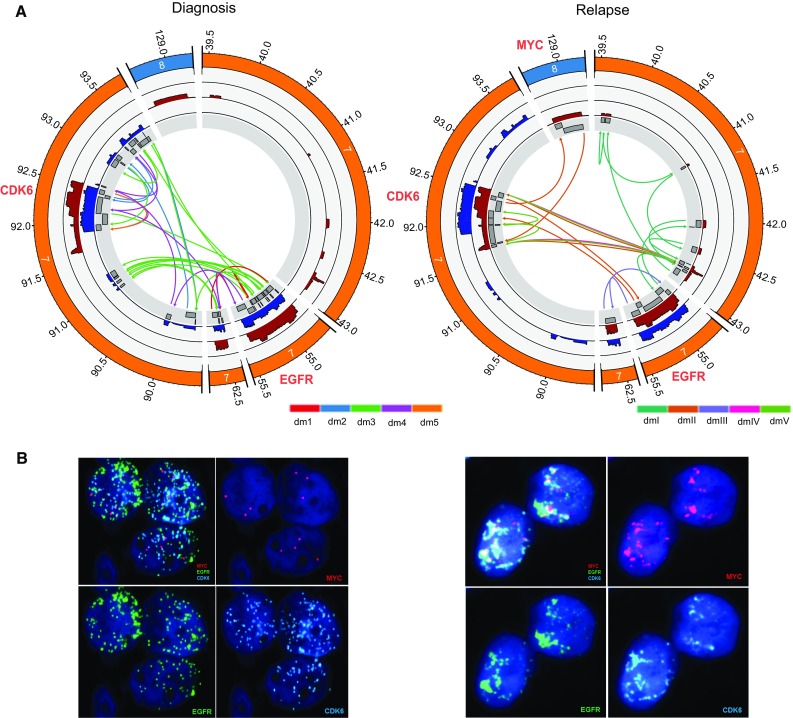
Fig. 1.

Predicted structures of double minutes and FISH analysis in the diagnosis and relapse samples of SJHGG019. a CIRCOS plots from the most inner circle to the most outer circle represent the highly amplified genomic segments, sequencing coverage of the diagnosis/relapse sample (blue/maroon) and genomic coordinates (×1000 kb) of the chromosomes. SVs between the segment boundaries are shown as arrows indicating the orientations of the joined segments constituting a double minutes. For each sample, the SVs associated with different double minute structures are colored differently. b Tri-Color FISH experiment shows that EGFR (green) in both samples, CDK6 (aqua) in both samples, MYC (magenta) in the relapse sample only, are localized to multiple punctae that are widely distributed in the nucleus of representative cells, suggesting that the presence of different double minutes. For each sample, the four panels represent FISH results for all three genes together and each gene separately
