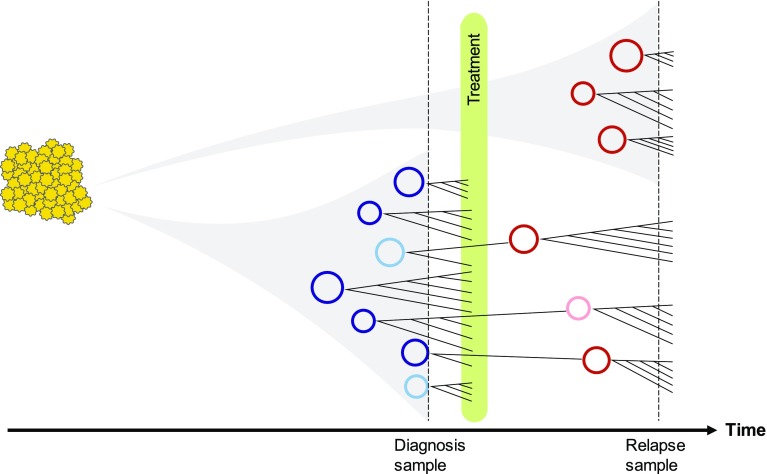
Fig. 5.
A schematic diagram illustrating the evolutionary trajectory of double minutes. The timeline at the bottom shows the time at diagnosis, treatment and relapse. Each circle represents a double minutes with unique structure. Circles in blue and maroon represent highly amplified double minutes in the diagnosis and relapse samples; circles in light blue and light maroon represent double minutes with low abundance in diagnosis and relapse samples. Every double minutes is mutable and can acquire new somatic SNVs, INDELs, and SVs which are then subject to selection. While some diagnosis double minutes may be eliminated by treatment, some may survive and expand. In addition, new double minutes can form after the treatment

