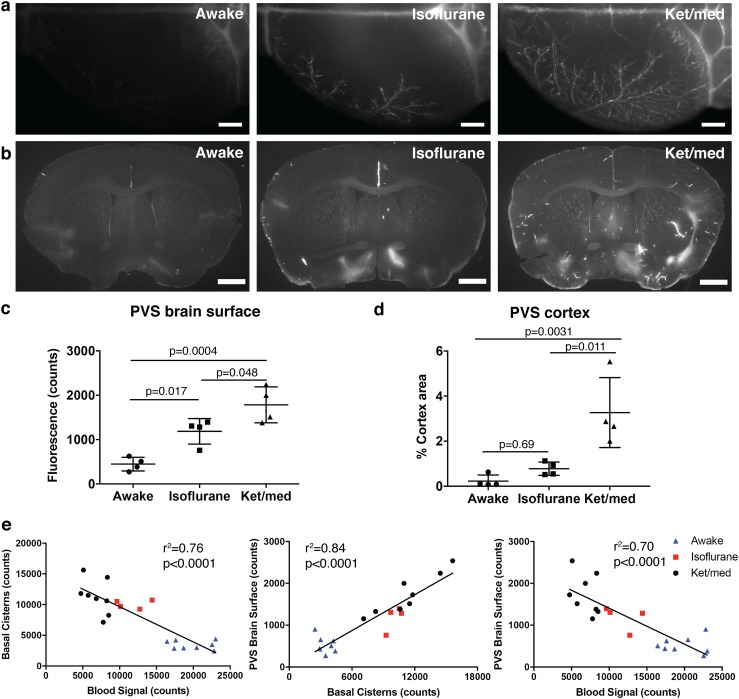
Fig. 3.
Spread to paravascular space (PVS) is inversely correlated to CSF outflow. a Representative images of tracer-filled PVS on the brain surface of the dorsal hemisphere contralateral to the infusion site. Scale bars: 1000 µm. b Representative images of tracer accumulation in PVS around penetrating vessels on 100 µm brain sections. Scale bars: 1000 µm. c Quantification of P40D680 signal on the brain surface 60 min after infusion. d Quantification of P40D680 signal in the cortex of the 100 µm brain sections 60 min after infusion. e Correlations from all mice examined at 60 min demonstrating relationships between signals at basal cisterns, brain surface and systemic blood. All quantifications are normalized to signals in n = 3 uninjected mice

