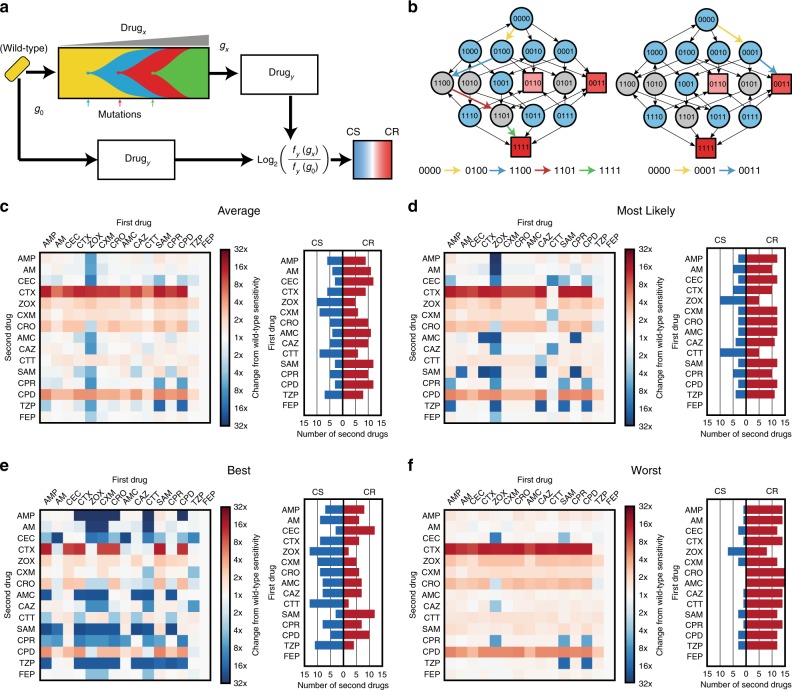
Fig. 2.
Mathematical modelling predicts highly variable collateral response. a A schematic of the model used to derive collateral response. Sequential mutations are simulated to fix in the population until a local optimum genotype arises. The fitness of this resultant genotype is compared to the fitness of the wild-type genotype for each of the panel of antibiotics. b The landscape for ampicillin derived by Mira et al.29 represented as a graph of genotypes. Arrows indicate fitness conferring mutations between genotypes represented as nodes. Blue nodes indicate genotypes from which evolution can stochastically diverge, grey nodes indicate genotypes from which there is only a single fitness conferring mutation. Squares indicate local optima of fitness with colour indicating the ordering of fitness amongst these optima (darker red indicates higher fitness). Two divergent evolutionary trajectories, in the sense of the model shown schematically in (a), are highlighted by coloured arrows. c–f The average, most likely, best case, and worst case tables of collateral response derived through stochastic simulation. Columns indicate the drug landscape under which the simulation was performed and rows indicate the follow-up drug under which the fold-change from wild-type susceptibility is calculated. Bar charts indicate, for each labelled first drug, the number of follow-up drugs exhibiting collateral sensitivity (blue) or cross-resistance (red) in each case. CS - collaterally sensitive, CR - cross resistant

