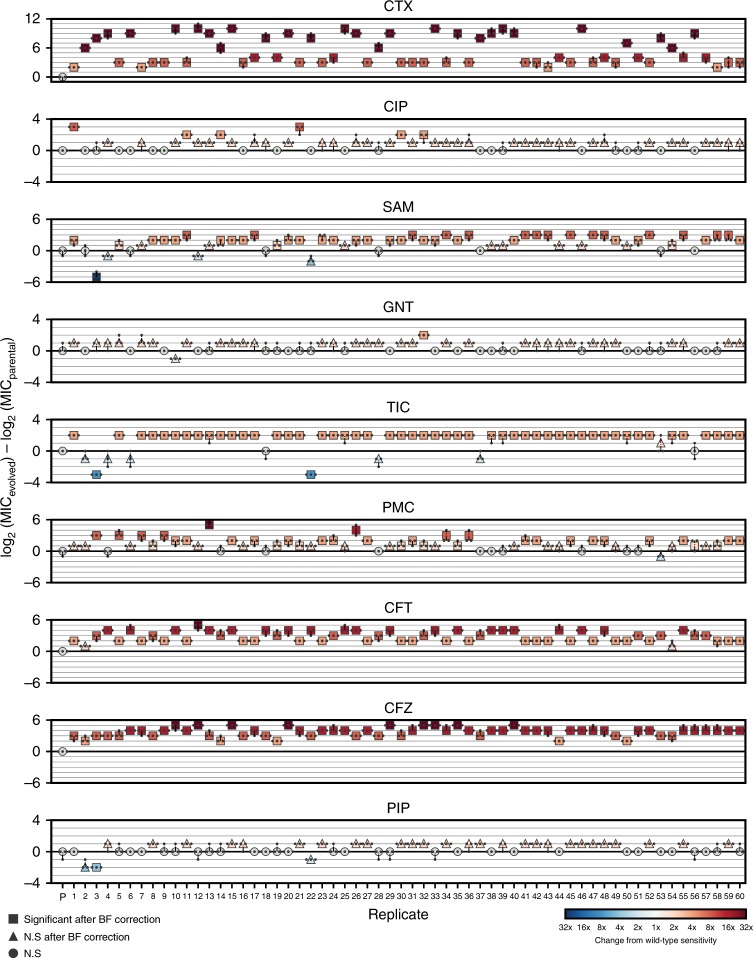
Fig. 4.
Collateral response following evolution under cefotaxime. The maximum likelihood estimates for the MICs of replicates X1–X60 under cefotaxime and eight other antibiotics. Small markers indicate individual measurements (taken in triplicate). Marker colour indicates fold-change from wild-type sensitivity (increased sensitivity—blues, increased resistance—reds). Significance is determined via a likelihood ratio test (see Methods) and Bonferroni (BF) corrected. Precise p values are reported in Supplementary Dataset 1

