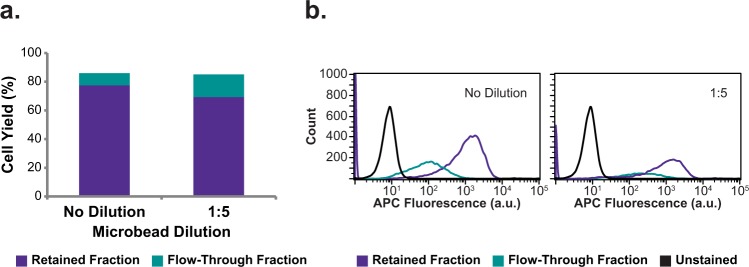
Figure 3.
Cell yield and flow cytometric analysis for high concentration antibody and microbead MACS optimization trials. Fixed SVF cells were labeled with 1:2.5 antibody dilutions prior to 1:5 or no dilution microbead labeling and then magnetically sorted. Retained and flow-through fractions were counted and percent cell yields calculated prior to flow cytometric analysis. (a) Percent cell yields, (b) flow cytometry fluorescence histograms of post-sort fractions (APC fluorescence corresponds to APC dye on anti-ALPL antibody).

