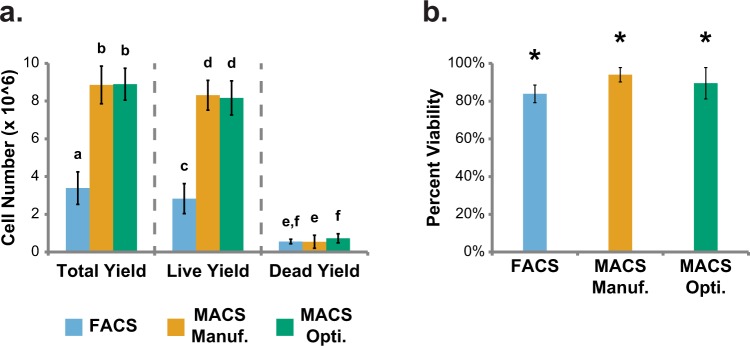
Figure 5.
Total, live, and dead cell yields and post-sort viabilities for FACS, manufacturer’s protocol MACS, and optimized protocol MACS sorts. Post-sort (a) total, live, and dead cell yields and (b) viabilities for FACS and manufacturer’s and optimized protocol MACS (a. Unlike letters within total, live, and dead yield sections indicate statistical difference, p < 0.05; b. *Indicates significant difference in viability among sorting methods, p < 0.05). Error bars indicate standard deviation. Average live cell input cell number: 8 × 10⁶ for all sorting methods. Average total cell input number: 10.7 ± 1.4 × 10⁶ for FACS, 9.5 ± 0.8 × 10⁶ for manufacturer’s protocol MACS, and 9.8 ± 0.3 × 10⁶ for optimized protocol MACS.

