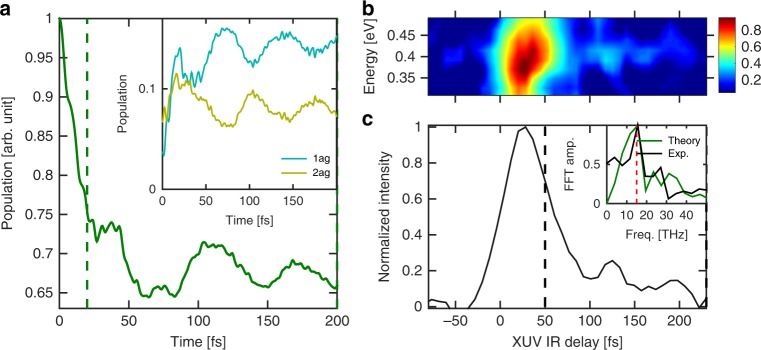
Fig. 4.
Long-lived vibronic coherence. a Computed time-dependent population following ionization from 6ag orbital (see Fig. 2c) computed with the help of the constructed vibronic-coupling model. The periodic structures are attributed to the ag vibrational modes (see inset). The 2ag state belongs to the experimental probing region whereas 1ag lies below. b Measured time-dependent electron spectrum mapping the relaxation of the 6ag states. c Experimental signal integrated over the electron kinetic energy in the range 0.4 ± 0.075 eV. The inset shows the FFT of the experimental signal taken from 50 to 250 fs (black) compared with the theory taken from 20 to 200 fs (green). This leads to an oscillation period of 65 fs

