Fig. 3.
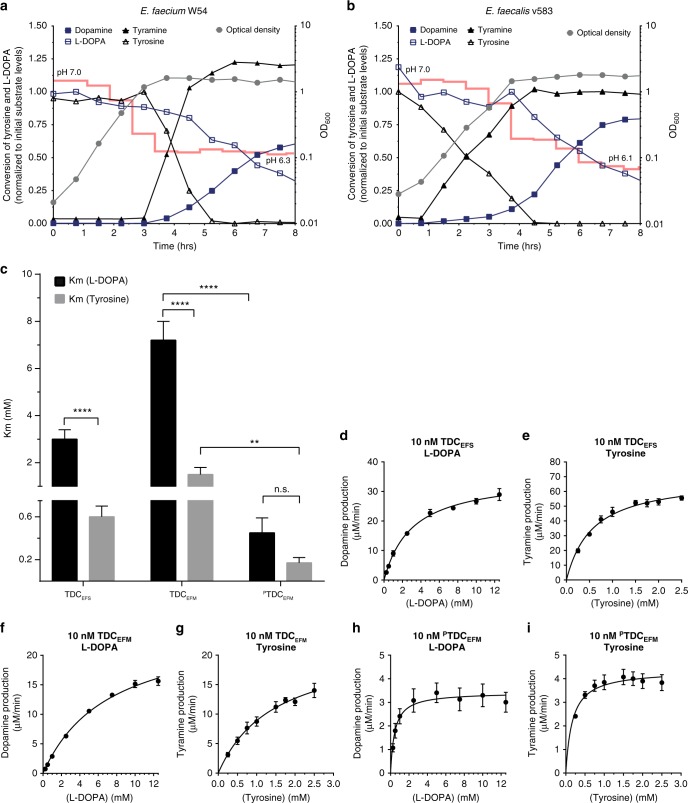
Enterococci decarboxylate levodopa in presence of tyrosine despite higher affinity for tyrosine in vitro. Growth curve (gray circle, right Y-axis) of E. faecium W54 (a) and E. faecalis (b) plotted together with levodopa (open square), dopamine (closed square), tyrosine (open triangle), and tyramine (closed triangle) levels (left Y-axis). Concentrations of product and substrate were normalized to the initial levels of the corresponding substrate (100 µM supplemented levodopa and ~500 µM tyrosine present in the medium). pH of the culture is indicated over time as a red line. c Substrate affinity (Km) for levodopa and tyrosine for purified tyrosine decarboxylases from E. faecalis v583 (TDCEFS), E. faecium W54 (TDCEFM, PTDCEFM). d–i Michaelis–Menten kinetic curves for levodopa and tyrosine as substrate for TDCEFS (d, e), TDCEFM (f, g), and PTDCEFM (h, i). Reactions were performed in triplicate using levodopa concentrations ranging from 0.5 to 12.5 mM and tyrosine concentrations ranging from 0.25 to 2.5 mM. The enzyme kinetic parameters were calculated using nonlinear Michaelis–Menten regression model. Error bars represent the SEM and significance was tested using 2-way-Anova, Fisher LSD test, (*p < 0.02; **p < 0.01; ****<0.0001)

