Fig. 5.
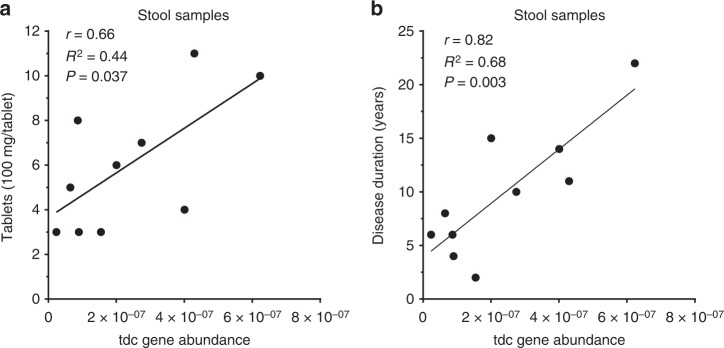
Tyrosine decarboxylase gene abundance correlates with daily levodopa dose and disease duration in fecal samples of Parkinson’s disease patients. a Scatter plot of tdc gene abundance measured by qPCR in fecal samples of PD patients (n = 10) versus daily levodopa/carbidopa dosage fitted with linear regression model. b Scatter plot of tdc gene abundance from the same samples versus disease duration fitted with a linear regression model. Pearson’s r analysis was used to determine significant correlations between tyrosine decarboxylase gene abundance and dosage (r = 0.66, R2 = 0.44, P value = 0.037) or disease duration (r = 0.82, R2 = 0.68, P value = 0.003)

