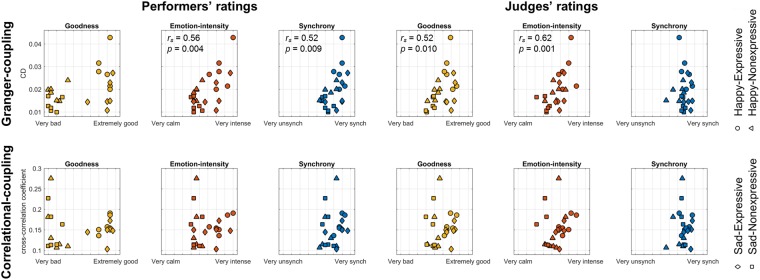
Figure 3.
Spearman rank correlation between rated degree of performances and performers’ body sway coupling. The scatter plots in the upper panel represent the Granger-coupling (indexed by CD) of body sway, and plots in the lower panel represent the correlational-coupling (indexed by mean cross-correlation coefficient). Each dot or cross represents the performance of a trial. The dots represent the performers’ self-rated results, and the crosses represent the judges’ rated results. Only the rank correlation coefficients (rs) and the p-values (p) of the significant correlations are shown.

