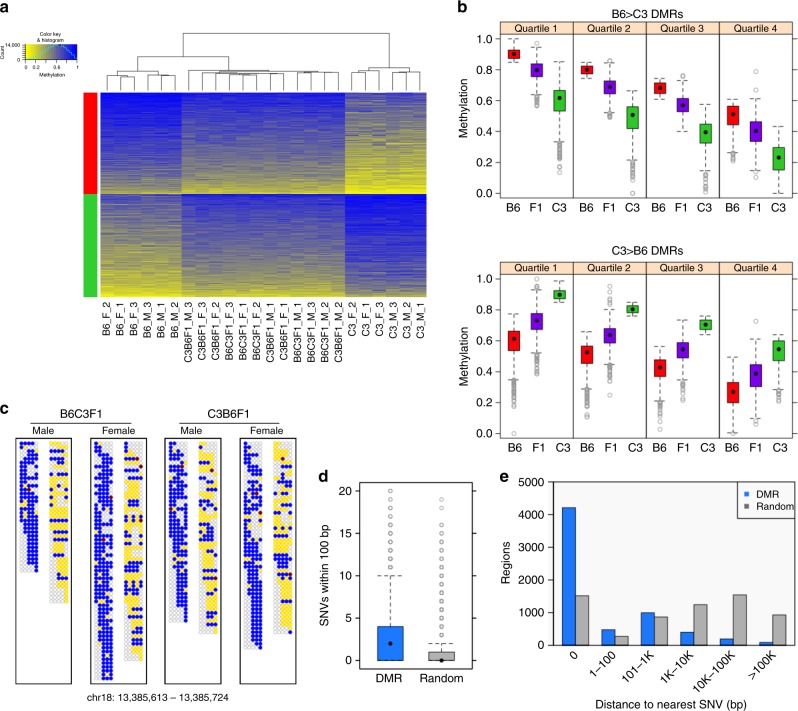
Fig. 3.
DNA methylation patterns at DSS genotype–DMRs are recapitulated on parental alleles in F1 progeny. a Heatmap view of weighted methylation scores per B6-vs.-C3 DSS DMR (N = 6380) per animal. Hierarchical clustering of animals performed by R package “amap” (hcluster with method = euclidean and link = average). DMRs were split by direction (B6 > C3: red bar, or C3 > B6: green bar) then sorted by average methylation score over all 24 animals. b Distribution of average weighted methylation scores, with DMRs (N = 6380) split into quartiles according to decreasing methylation score of the hypermethylated parental genome. The comparison between B6 and F1 or between C3 and F1 are significant at p < 1e−80 (Mann–Whitney) in all quartiles. c Methylation in F1 progeny at the read level for an exemplar DSS DMR (B6 > C3). Each box represents the collection of read fragments (for a given F1 genotype) that could be unambiguously assigned as originating from either the B6 parent (left side) or the C3 parent (right side) based on the presence of a diagnostic SNV. Each row within a box and column represents one sequenced fragment, with each CpG site indicated by a circle colored according to the following scheme: yellow = unmethylated cytosine, blue = methylated cytosine, red = noncytosine, and empty/gray = no mapped base at given CpG site in given fragment. d Number of SNVs local to DMRs (N = 6380), compared to size-matched random genomic regions (N = 6380). p < 1e−300 (Mann–Whitney test). e Distribution of distance to the nearest SNV for DMRs (N = 6380) or size-matched random genomic regions (N = 6380). Distance = 0 indicates that at least one SNV is found within a region of a given type. In the box-and-whisker plots, the box depicts the 25th to 75th percentiles, the black dot is the median, the whiskers extend to data points up to 1.5*IQR beyond the box, and open gray circles are data points outside the whisker range

