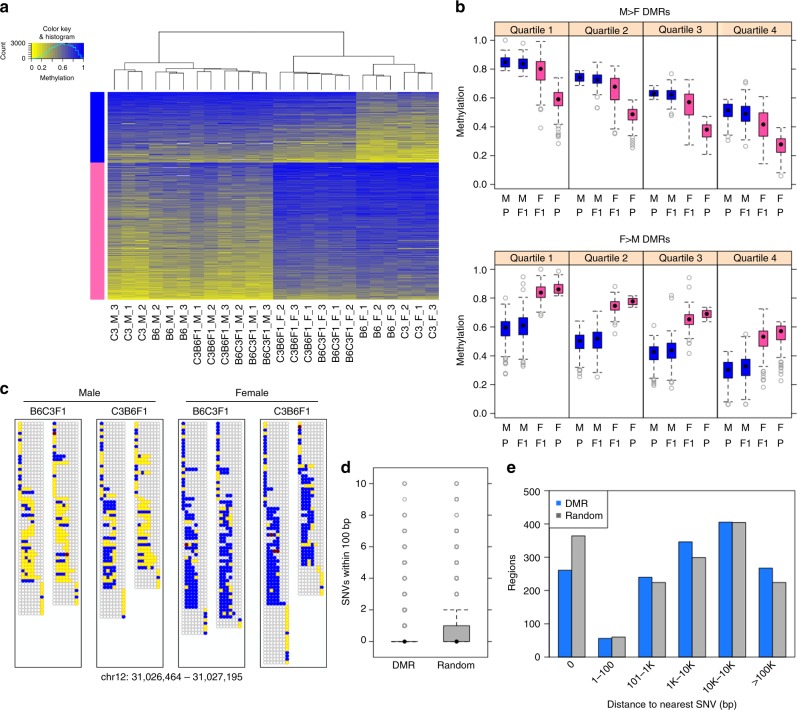
Fig. 6.
Recapitulation of DNA methylation patterns at DSS sex-DMRs in F1 progeny varies by DMR polarity. a Heatmap view of weighted methylation scores per male-vs.-female DSS DMR (N = 1575) per animal. Hierarchical clustering of animals performed by R package “amap” (hcluster with method = euclidean and link = average). DMRs were split by direction (M > F: blue bar, or F > M: pink bar) then sorted by average methylation score over all 24 animals. b Distribution of average weighted methylation scores, with DMRs split into quartiles according to decreasing methylation score of the hypermethylated parental sex. Animals are grouped according to both sex (M, F) and genotype group (P = parental B6 or C3, F1 = offspring B6C3F1 or C3B6F1). c Methylation in F1 progeny at the read level for an exemplar DSS DMR, organized as described for Fig3C. d Number of SNVs local to DMRs (N = 1575), compared to size-matched random genomic regions (N = 1575). e Distribution of distance to the nearest SNV for DMRs (N = 1575) or size-matched random genomic regions (N = 1575). Distance = 0 indicates that at least one SNV is found within a region of a given type. In the box-and-whisker plots, the box depicts the 25th to 75th percentiles, the black dot is the median, the whiskers extend to data points up to 1.5*IQR beyond the box, and open gray circles are data points outside the whisker range

