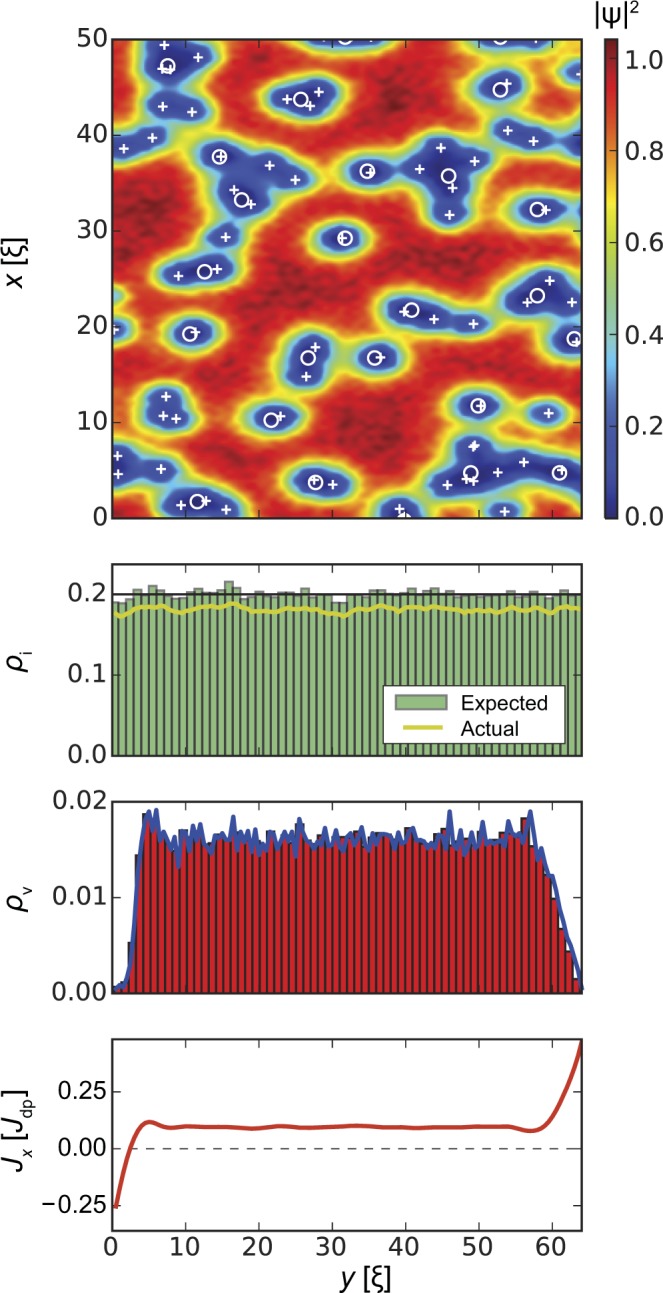
Figure 3.

Strip with homogeneous distribution of inclusion density, lin = lout = 0, ρi = f = 0.2 in an applied magnetic field B = 0.1Hc2. Top panel shows the squared absolute value of the order parameter |ψ(r)|2. Circles and crosses show inclusion and vortex positions, respectively. Second panel shows the distribution of the inclusions across the strip (y direction). The black line shows the ‘requested’ volume fraction f = 0.2, the green histogram shows the distribution of the centres of the inclusions, and the yellow line shows the actual volume fraction occupied by the generated defects. (the actual volume fraction is typically lower than the specified/requested one due to defect overlaps and fluctuations of finite random number sequences.) Third panel demonstrates the density ρv of vortices. Bottom panel shows the local current density Jx(y). As expected, the edge screening currents at the surface are in opposite directions, while the small local minimum and maximum a few ξ away from the edge are related to an alignment of vortices at the interior surface barrier. The average critical current density is .
