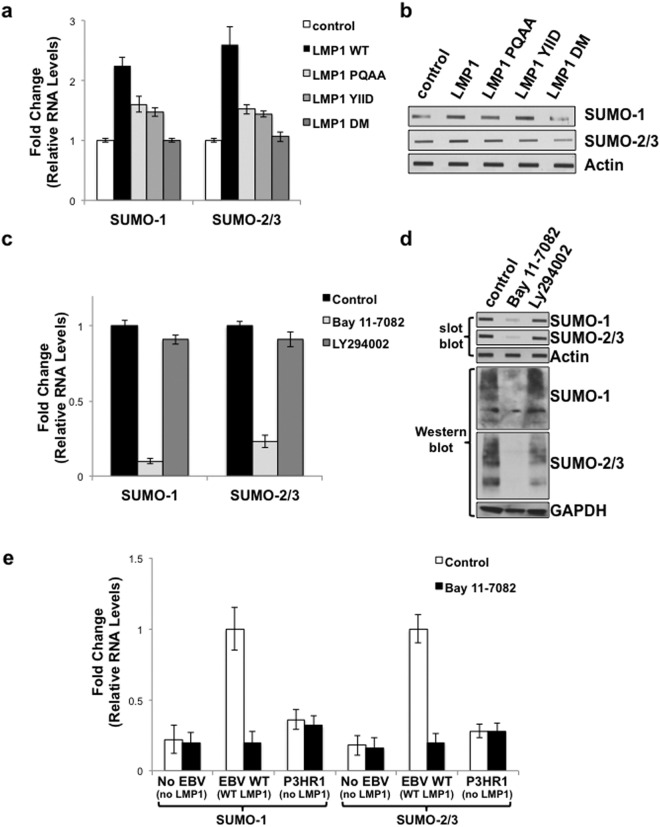
Figure 3.
LMP1 CTAR1 and CTAR2 contributed to LMP1-mediated increase in sumo levels via the activation of NF-κB. (a,b) 293 cells were transfected with 1 μg of a LMP1-expression plasmid, select LMP1 mutant-expression plasmid, or a pcDNA3 control plasmid. (a) RNA was harvested and cDNA was prepared. Real-time PCR was performed to quantitate relative sumo-1 and sumo-2/3 levels (relative to gapdh), The fold change in sumo-1 and sumo-2/3 levels (compared to control-expressing cells) was determined. Results are shown as the mean ± the standard deviation for samples performed in triplicate and independent experiments performed in triplicate. (b) Slot blots were performed to detect SUMO-1 and SUMO-2/3 levels. Actin was used as a loading control. Representative blots for experiments performed in triplicate are shown. (c,d) EBV-transformed LCLs were treated with Bay 11–7082 (1 μM), LY294002 (5 μM), or DMSO (the vehicle control; Control) for 24 hours. (c) RNA was harvested and cDNA was prepared. Real-time PCR was performed to quantitate relative sumo-1, and sumo-2/3 expression (relative to gapdh), and the fold change in sumo-1 and sumo-2/3 levels (relative to control-treated cells) was determined. Results are shown as the mean ± the standard deviation for samples performed in triplicate and independent experiments performed in triplicate. (d) Slot immunoblots and Western blots analyses were performed to detect SUMO-1 and SUMO-2/3 levels. GAPDH was used as a loading control. Representative blots for experiments performed in triplicate are shown. (e) cDNA generated from RNA harvested from BL41 EBV-negative, BL41 EBV WT, and BL41 EBV mut (P3HR1) cells that were treated with DMSO (the vehicle control; control) or Bay 11–7085 (1 μM) for 24 hours. Real-time PCR was performed was performed to quantitate relative sumo-1, and sumo-2/3 levels (relative to gapdh). The fold change in sumo-1 and sumo-2/3 levels (relative to control-treated BL41 EBV WT cells) was determined. Results are shown as the mean ± the standard deviation for samples performed in triplicate and independent experiments performed in triplicate.

