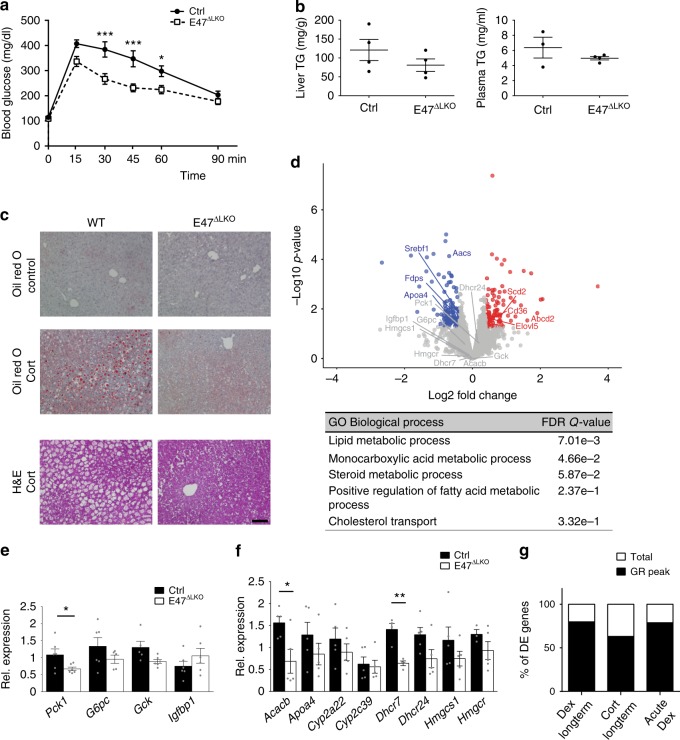
Fig. 3.
Hepatocyte-specific deletion of E47 recapitulates the protective effect. a i.p. GTT in Albumin-Cre x E47flox/flox (E47ΔLKO) and control mice on Dex. The data were analyzed by ANOVA and Bonferroni’s multiple comparison test and are shown as mean ± SEM. Asterisks indicate significance, *P < 0.05, ***P < 0.001, n = 11. b Liver and plasma triglycerides after Cort. Data are mean ± SEM, n = 4 per genotype. c Liver sections stained with Oil Red O and H&E before and after Cort. ×20 magnification, black scale bar: 100 μm, n = 1. d Volcano plot and GO analysis of deregulated genes (blue = down-; red = upregulated, FC 1.3, P < 0.05) in E47ΔLKO livers after 1 h Dex (n = 3). For GO analysis a base mean cutoff > 200 was used. e qRT-PCR of gluconeogenic genes in livers on Dex, normalized to U36b4. The data are mean ± SEM, *P < 0.05, Student’s t test, n = 6. f qRT-PCR of metabolic genes after Cort, normalized to U36b4. The data are mean ± SEM, *P < 0.05, Student’s t test, n = 5. g Percentage of genes differentially expressed in E47 mutant mice (Fig. 2 and 3) which harbor a detectable GR ChIP peak nearby

