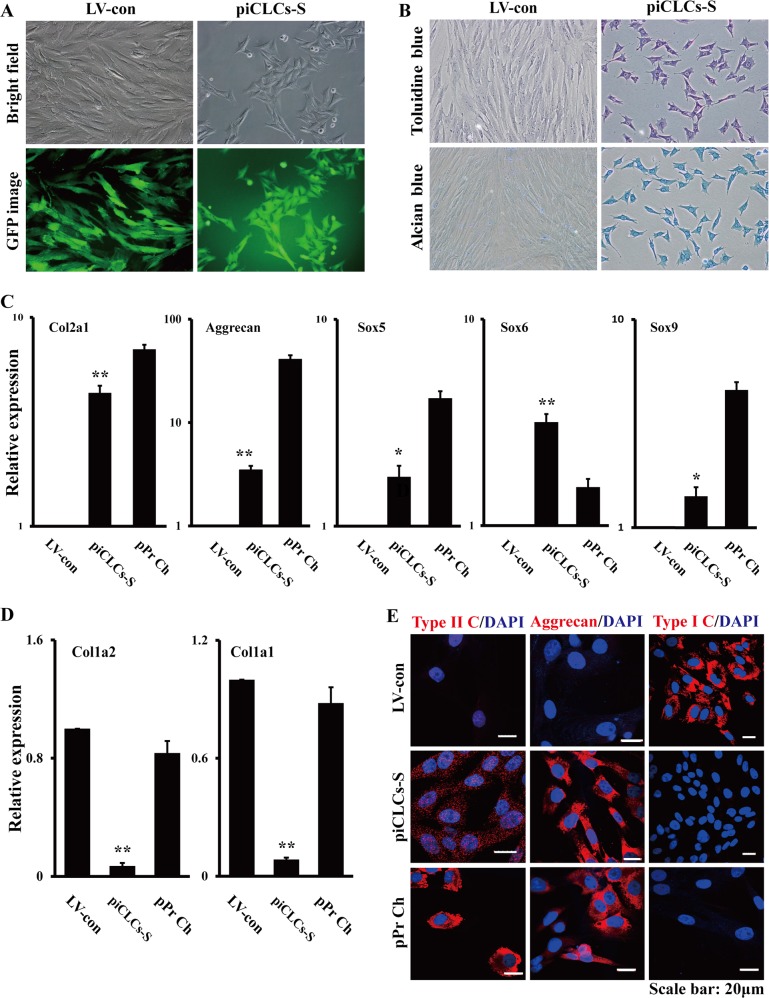
Fig. 5. Chondrocyte marker gene expression analyses of the single subclone derived from mixed piCLCs (referred to as piCLCs-S).
a Cell morphologies of piCLCs-S. b Toluidine blue staining and alcian blue staining of piCLCs-S. c, d qRT-PCR analysis of chondrocyte (c) and fibroblast (d) marker gene expression in the indicated cells. In (c) and (d), error bars indicate mean ± SD (n = 3). e Immunofluorescence analysis showing protein expression of type I collagen (type I C), type II collagen (type II C) and aggrecan in the indicated cells. Nuclei were counterstained with DAPI

