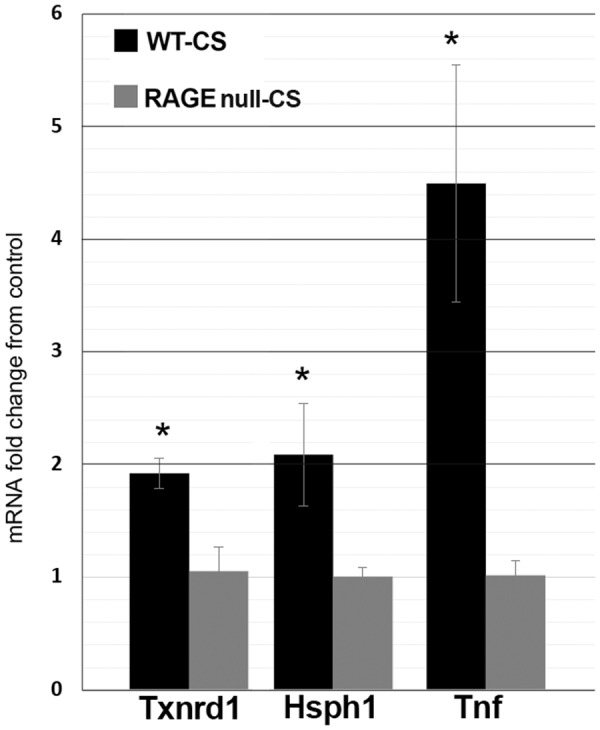
Figure 5.

Quantitative PCR validates the RNA sequencing differences between WT and RAGE null mice AM following 7 days of CS exposure. Thioredoxin reductase 1 (Txnrd1) was used to verify RNA sequencing findings related to oxidative stress, heat shock 105 kDa/110 kDa protein 1 (Hsph1) for ER stress, and tumor necrosis factor (Tnf) for cytokine production. Values represent the mean and standard error of 3 mice per group. * Denotes statistical significance from CS-exposed RAGE null mice (p < 0.05) by Student’s t-test. Black and grey bars represent CS-exposed WT and CS-exposed RAGE null mice, respectively. The results are expressed as fold change of gene expression in CS-exposed over control AM values for each mouse genotype.
