Fig. 3.
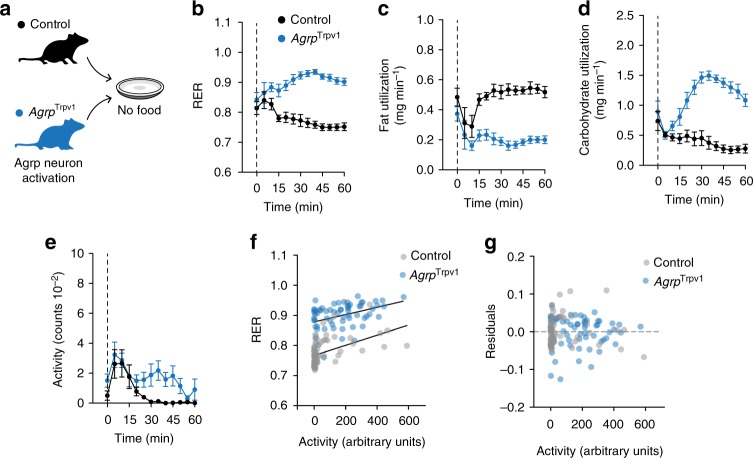
Agrp neuron activation induces a shift in substrate utilization. a Control (black, n = 5) and AgrpTrpv1 (blue, n = 5) mice were tested in indirect calorimetry chambers upon injection of capsaicin without food provided. b Respiratory exchange ratio (RER) (interaction: F12, 96 = 8.96, P < 0.0001; time: F12, 96 = 1.31, P = 0.22; genotype: F1, 8 = 54.45, P < 0.0001). c Calculated fat utilization (interaction: F12, 96 = 3.52, P = 0.0002; time: F12, 96 = 3.23, P = 0.0006; genotype: F1, 8 = 55.31, P < 0.0001). d Calculated carbohydrate utilization (interaction: F12, 96 = 13.52, P < 0.0001; time: F12, 96 = 6.25, P < 0.0001; genotype: F1, 8 = 58.16, P < 0.0001). e Ambulatory activity (interaction: F12, 96 = 1.12, P = 0.34; time: F12, 96 = 7.13, P < 0.0001; genotype: F1, 8 = 5.29, P = 0.05). f Linear regression models of activity levels (in arbitrary units) and RER in control (gray) and AgrpTrpv1 (red) mice. g Residuals from the linear regression model. In b, c, d and e, statistical analysis was performed using two-way analysis of variance (ANOVA) with time as a repeated measure followed by Holm–Sidak’s multiple comparisons test (MCT; not shown). Dashed line indicates time of capsaicin injection. Symbols indicate mean ± SEM

