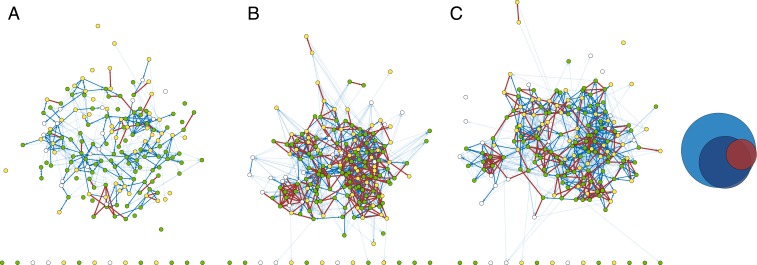
Fig. 1.
The emergence of social networks between students. Data collected in the first study week (September 2016) (A), after 3 months (December 2016) (B), and after 8 months (May 2017) (C) are shown. The final measurement took place two-and-a-half months before the examination period in August 2017. Light blue ties represent positive interactions (the most common relationship), dark blue ties friendships, and red ties studying relationships. Node colors indicate passing (green), failing (yellow), and not attempting the final examination (white). The Venn diagram in C shows the relative number of ties and the overlap between them at the third time point. (n = 183; 43 students were omitted from these plots by criteria described in SI Appendix, section 2.1.)

