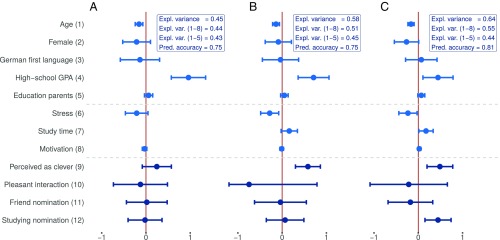
Fig. 4.
Individual and social network factors explaining success. Estimates and 95% confidence intervals from linear regression models on the examination GPA of those students who took the examination are shown. Variables 1–5 are baseline factors, and variables 6–12 relate to data collected in the first week (A), after 3 months (B), and after 8 months (C). Further details about the results are provided in SI Appendix, section 3.1.1. Expl, explained; Pred, predictive; var, variance.

