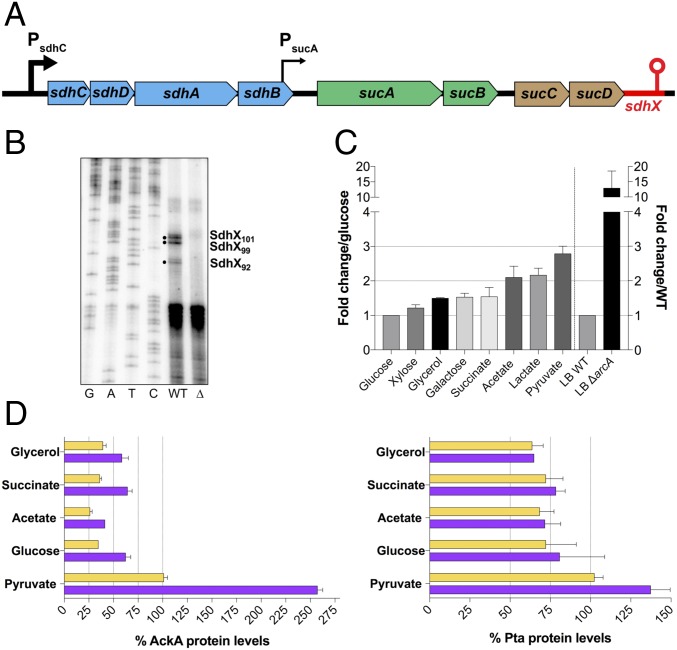
Fig. 4.
Characterization of SdhX as a processed 3′UTR-derived sRNA. (A) Schematic shows the sdh and suc genes, PsdhC and weak constitutive PsucA promoters (35) (black arrows) and sRNA gene (red). Genes coding for succinate dehydrogenase are colored in blue, 2-oxoglutarate dehydrogenase in green, and succinyl-CoA synthetase in brown. (B) Mapping of SdhX 5′ ends by primer extension. Analysis was carried out using primer FDM17 (SI Appendix, Table S3) on total RNA isolated from NM525 (wild type) and isogenic ΔsdhX (Δ) (FDM1708) cells grown to OD600 of 4 in LB medium. Solid bullets indicate prominent extension products present in the wild-type strain but absent in the ΔsdhX strain. The first four lanes are sequencing ladders. (C) Quantification of endogenous SdhX expression for cells (NM525) grown in MOPS minimal medium supplemented with different carbon sources plotted relative to growth in glucose (left side of graph) or in LB rich medium with ΔarcA derivative (FDM1733) relative to wild type (right side of graph). Cells were grown overnight with the indicated carbon source in minimal medium and diluted to an OD600 of 0.05 into the same type of media. Cells were then grown until midexponentional phase (OD600 ∼ 0.4) before isolation of total RNA. Wild-type cells in LB medium express about 10 times less SdhX than cells grown in MOPS minimal medium supplemented with glucose during midexponential growth. The concentration of specific carbon sources was 0.5% glycerol, 0.2% d-glucose, 0.2% d-xylose, 0.2% d-galactose, 60 mM sodium acetate, 0.6% sodium DL-lactate, 0.6% sodium pyruvate, and 0.8% sodium succinate hexahydrate. Results are representative of two independent experiments; data are plotted as mean ± SD. SI Appendix, Fig. S6C shows one of these Northern blots. (D) Western blot quantification of AckA and Pta relative protein levels from a wild-type strain (FDM1714) (yellow bars) and isogenic ΔsdhX (FDM1715) (purple bars) grown with the indicated carbon sources during midexponential growth (OD600 ∼ 0.4). Experiments were repeated two times; a representative blot is shown in SI Appendix, Fig. S7.

