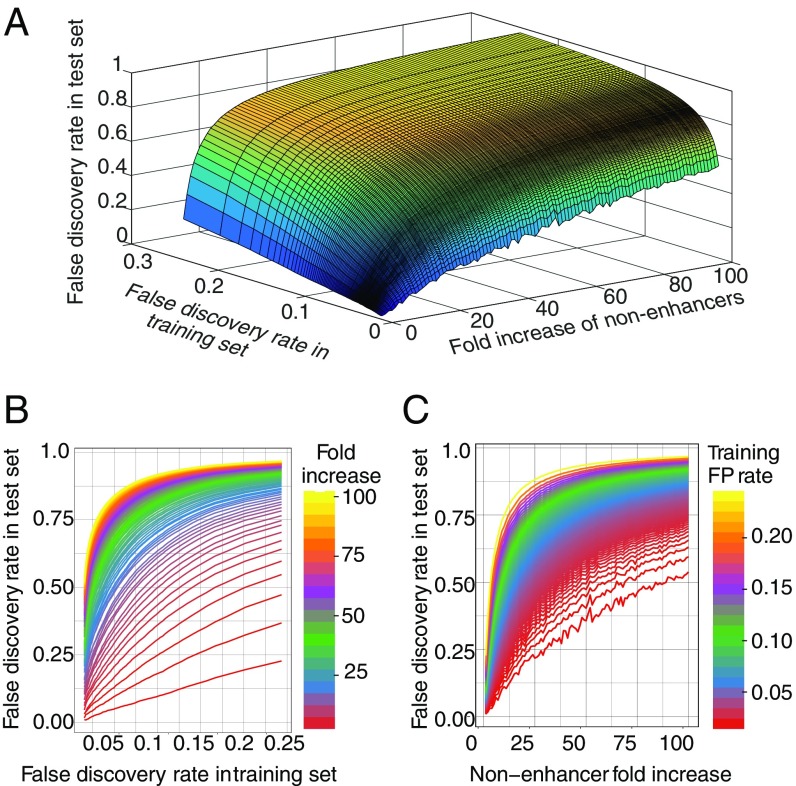
Fig. 2.
False-positive rate is a function of method accuracy and imbalance in the test data. (A) A 3D surface plot shows a sharp increase in the test-set false-positive rate as either the training set false-positive rate or the fraction of nonenhancer regions in the test-set increase. This shows that in genomic settings, where the imbalance cannot be controlled, a very high degree of accuracy is required. (B and C) Two-dimensional plots of the marginals of the 3D image in A, demonstrating the sharp rise in test inaccuracy for both false-positive rate in the training set or dilution of enhancer class in the test set.

