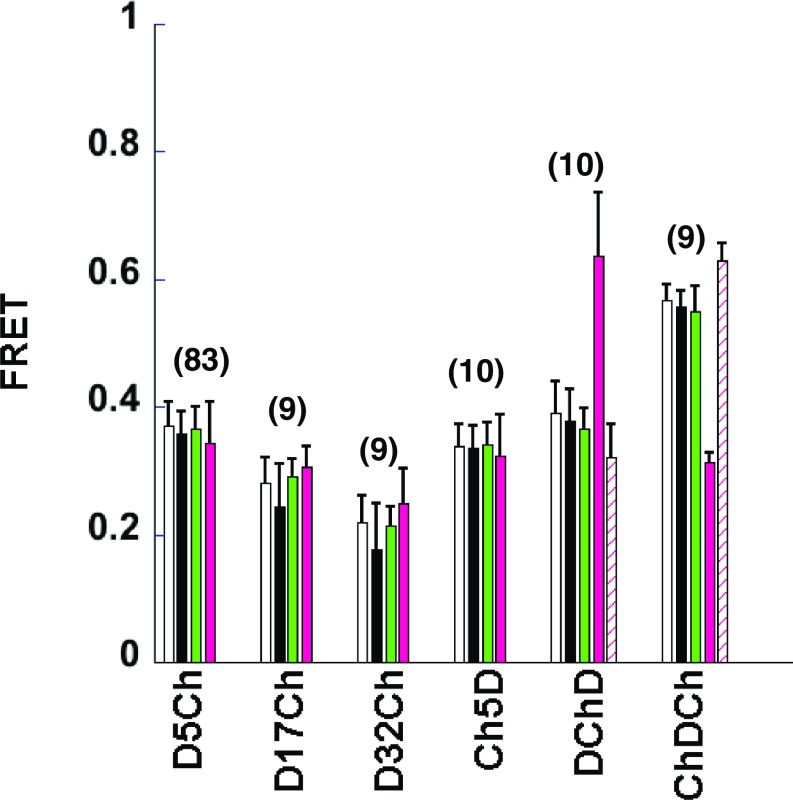
Fig. 4.
psFRET data can be analyzed using multiple approaches. COS 7 cells expressing the indicated chimera were imaged using our psFRET protocol. The white columns represent the data presented in Fig. 2C for comparison here. These FRET efficiencies were determined by measuring the mean pixel values in an ROI over a photoswitching cycle, fitting the decay, and using the rate constant for Dronpa alone in Eq. 2. The black column FRET efficiencies were determined from pixel-by-pixel fits of psFRET experiments. The mean pixel values from the resulting rate constant images of the indicated chimeras were compared with the mean pixel values from the Dronpa alone rate constant images to calculate the FRET efficiencies using Eq. 2. The green column EfD FRET efficiencies were determined using the sensitized emission signal as discussed in the text. The magenta column FRET efficiencies represent EfA determined using Eq. 11, the sensitized emission signal, and the direct acceptor excitation as described for the green columns. Similarly, the cross-hatched magenta column FRET efficiencies represent EfA determined using Eq. 11, in which the extinction coefficients for DChD and ChDCh were scaled εD = 125,200 mol−1 cm−1 and εA = 15,400 mol−1 cm−1 to match the number of donors or number of acceptors in the chimera, respectively. Data represent mean ± SD, and the number of cells is indicated on the graph.

