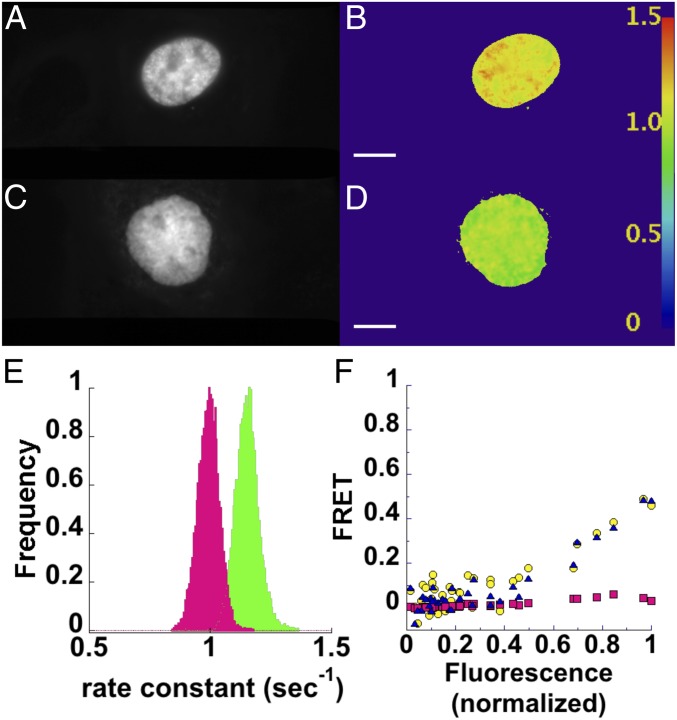
Fig. 5.
psFRET monitors FRET between histone H2B proteins in living cells. COS 7 cells expressing H2B–Dronpa (A) or H2B–Dronpa and H2B–mCherry (C) were imaged by photoswitching. Rate constant images were created from pixel-by-pixel fits of the photoswitching decays for H2B–Dronpa in the absence (B) or presence (D) of H2B–mCherry. The lookup table displayed at the right can be used to examine the rate constants (seconds−1) measured in different regions of these cells. (E) Histograms show H2B–Dronpa photoswitching rate constants in the absence (green) or presence of H2B–mCherry (magenta). (F) FRET efficiencies of nuclear ROIs were determined by fitting photoswitching kinetics (EfD; yellow circles), from sensitized emission using Eq. 8 (EfD; blue triangles), and from sensitized emission using Eq. 11 (EfA; magenta squares). These are shown as a function of total fluorescence from Dronpa and mCherry normalized to the highest signal. (Scale bars: 10 µm; scale is identical in all images.)

