Fig. 1.
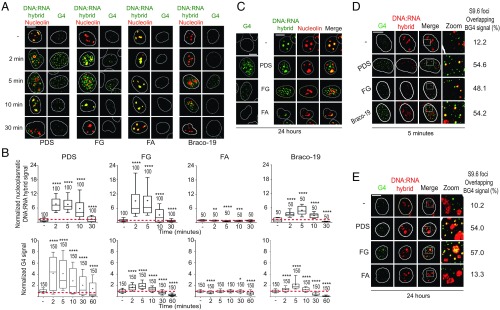
G4 binders induce nuclear DNA:RNA hybrids overlapping G4 foci. (A) Human U2OS cells were treated with PDS, FG, FA (10 µM), or Braco-19 (15 µM) for the indicated times. IF images were analyzed after labeling G4s, hybrids, and nucleolin with BG4, S9.6, and AB22758 antibodies, respectively (as indicated by color). White lines indicate nuclei. (B) Hybrid and G4 levels were determined by fluorescence intensity (FI) of cells treated as in A. FI of the nucleoplasmic compartment was calculated by subtracting the nucleolar signal from total nuclear FI. The graphs show FI levels normalized over untreated cells of two biological replicates, and numbers indicate analyzed nuclei. Boxplots are as detailed in SI Appendix, Methods; horizontal lines and plus signs are median and mean values, respectively. Asterisks indicate statistical significance in comparison with untreated cells by the Kolmogorov–Smirnov parametric test. *P < 0.05, **P < 0.01, ***P < 0.001, ****P < 0.0001. (C) G4 foci and hybrid signals induced by 24-h treatments with 10 µM PDS, FG, or FA. U2OS cells were stained as in A. Hybrid and G4 levels are shown in SI Appendix, Fig. S2C. (D) Colocalization of hybrid signals with G4 foci. Cells were treated as in A for 5 min and then stained with BG4 (green) and S9.6 (red) antibodies. (E) Colocalization of hybrid signals with G4 foci as in D, but cells were treated for 24 h. (Scale bars, 10 μm.)

