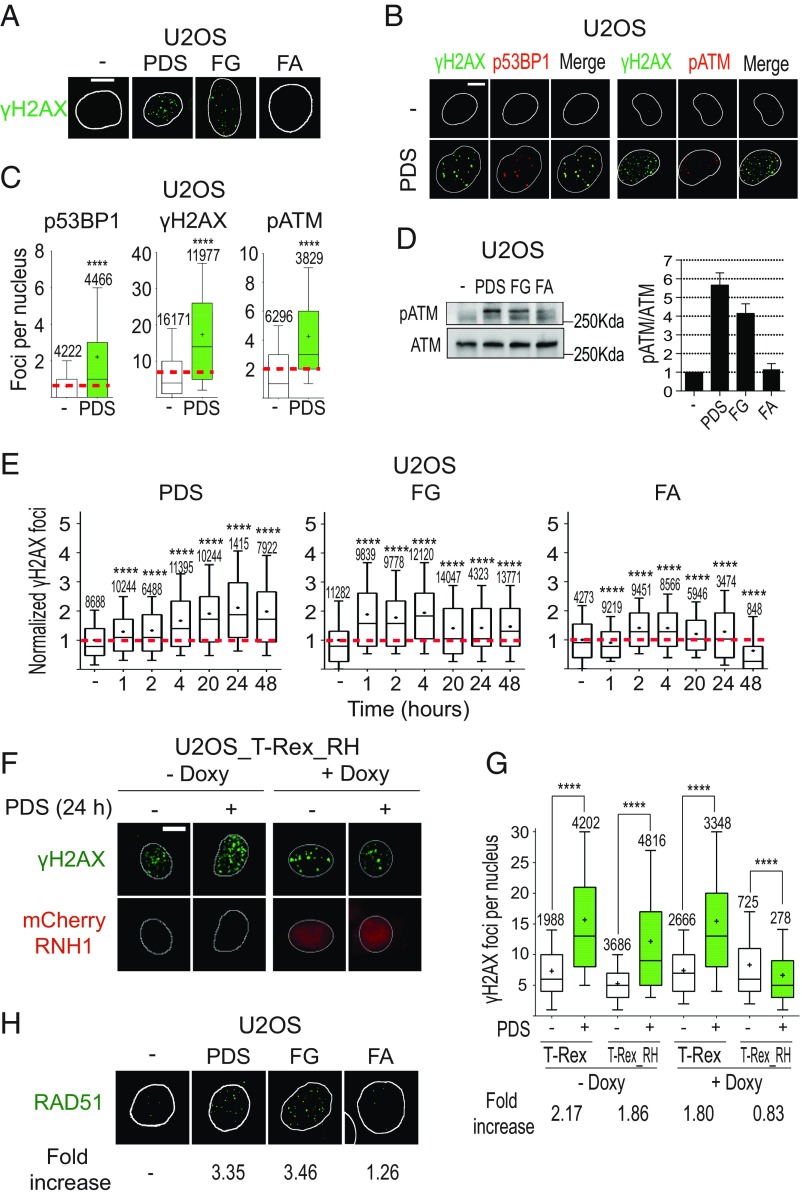
Fig. 4.
PDS and FG induce DNA damage in an R loop-dependent manner. (A) γH2AX (S139-phosphorylated H2AX) foci induced by 10 μM PDS, FG, and FA following 24-h treatments. (B) Colocalization of γH2AX foci with p53BP1 (S1778-phosphorylated 53BP1) or pATM (S1981-phosphorylated ATM) foci in cells treated with 10 μM PDS for 24 h. Cells were costained for γH2AX (green) and p53BP1 (red) (Left), and for γH2AX (green) and pATM (red) (Right). (C) Levels of γH2AX, p53BP1, and pATM signals in cells treated as in B. (D) Western blots of pATM and ATM after 24-h treatments with 10 μM compounds (full membrane is shown in SI Appendix, Fig. S6C). (D, Right) Levels of the pATM/ATM ratio after treatment with the indicated compound. The graph shows mean values with standard errors of three biological replicates. (E) γH2AX focus levels in U2OS cells treated with the indicated compounds and for the indicated times. (F) PDS-induced γH2AX foci in cells expressing an exogenous RNaseH1. T-REX (control vector) and T-REX_RH (RNaseH1-expressing vector) stably transfected U2OS cells were treated with 10 μM PDS for 24 h with or without doxycycline, which activates RNaseH1 expression. RNaseH1 was fused to an mCherry tag to visualize cells with expressed enzyme. (G) γH2AX levels in T-REX and T-REX_RH cells treated (green bars) or not (white bars) with PDS as in F. Fold increase shows ratios of γH2AX levels in PDS-treated cells over corresponding untreated cells. (H) RAD51 foci induced by the indicated compounds (10 μM) after 24-h treatments of U2OS cells. (Scale bars, 10 μm.) All graphs show data from at least two biological replicates, reported as detailed in the legend to Fig. 1B. Asterisks indicate statistical significance in comparison with untreated cells by the Kolmogorov–Smirnov parametric test. ****P < 0.0001. (Magnification: H, 63×.)

