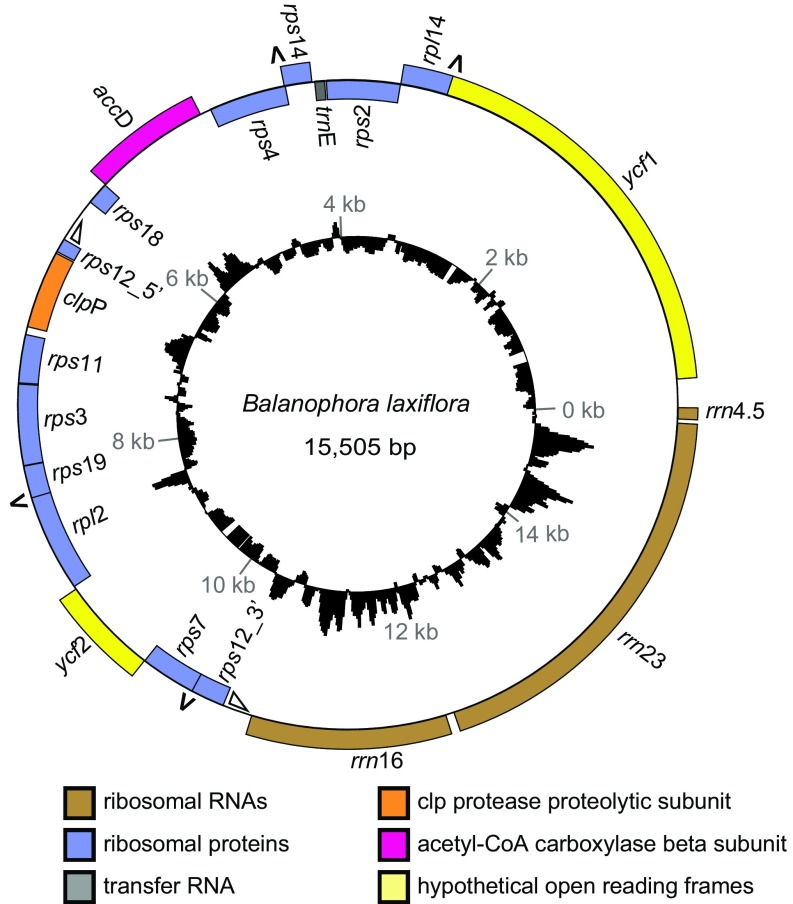
Fig. 2.
Circular map of the B. laxiflora plastome. Genes shown inside and outside the outer circle are transcribed clockwise and counterclockwise, respectively. Triangles mark the two portions, of undetermined extent, of the trans-spliced intron in rps12. The four pairs of overlapping genes are marked with inverted “V”s. The histogram shows GC content that is greater than (outside the circle) or less than (inside the circle) the plastome average of 12.2% GC.

