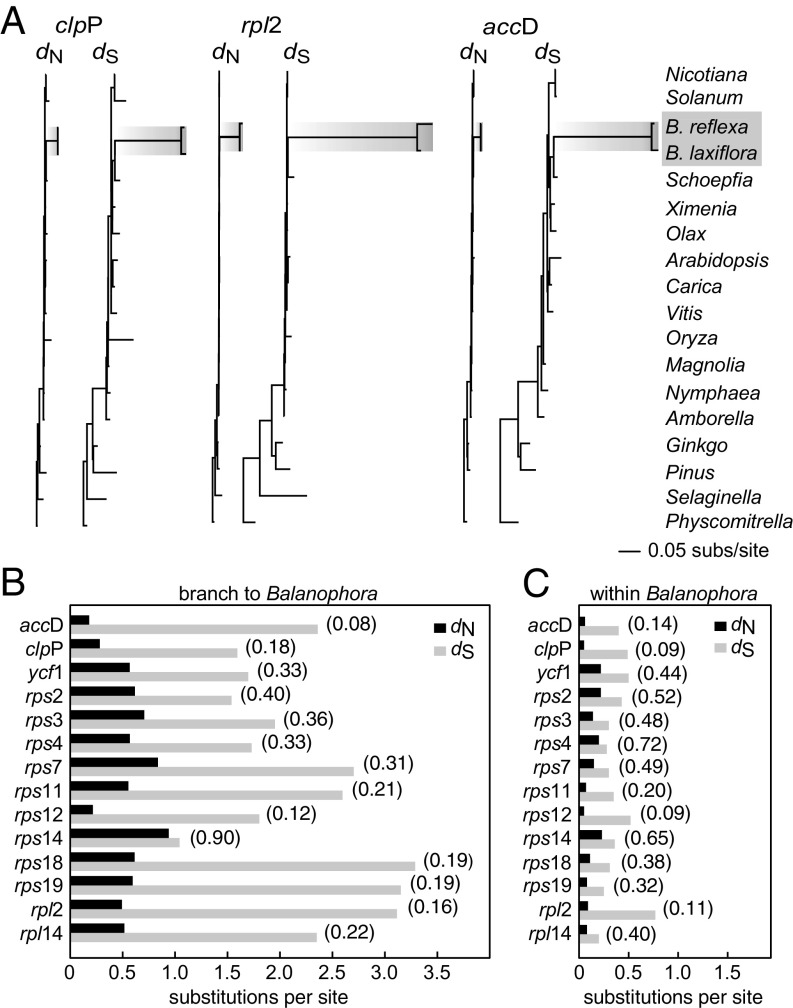
Fig. 4.
Sequence divergence of plastid genes. (A) Phylograms of nonsynonymous (dN) and synonymous (dS) site divergence for the three indicated genes. (B and C) Levels of dN (in black) and dS (in light gray) on the branch leading to Balanophora (B) and in pairwise comparisons between the two Balanophora plastomes (C). dN/dS ratios are given in parentheses.

