Fig. 2.
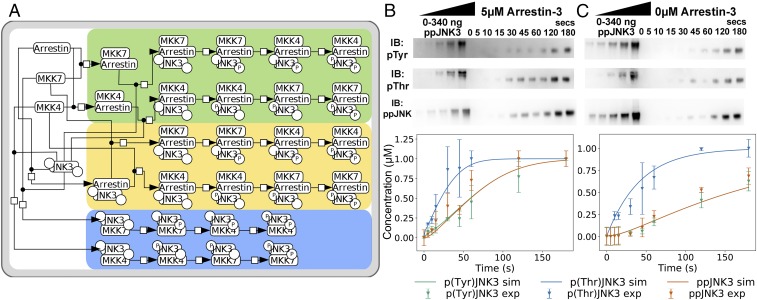
Phosphorylation of inactive JNK3 by upstream kinases MKK4/7. (A) Network of the interactions between MKK4, MKK7, and JNK3 with arrestin-3. Nodes represent the different complexes formed by the interacting species, and the circles in the JNK3 node show the phosphorylation state of the tyrosine (Left) and threonine (Right) sites. The different orders in which JNK3 can be phosphorylated are highlighted by color: arrestin-3:MKK4/7 formation before JNK3 binding (green); arrestin-3:JNK3 complex formation before MKK4/7 binding (yellow); and MKK4/7 binding JNK3 in the absence of arrestin-3 (blue). The convention of Kitano et al. (64) was followed. (B and C) Representative Western blots showing phosphorylation of inactive JNK3 by MKK4 (Top, pTyr), MKK7 (Middle, pThr), or both kinases (Bottom, ppJNK3) at indicated time points upon coincubation of the three kinases in the presence of 5 µM arrestin-3(1–393) (B) or in its absence (C). Standards of ppJNK3 (20–340 ng) were used to calculate the nanograms of singly phosphorylated or doubly phosphorylated JNK3 generated over time (n = 3). JNK3 phosphorylation at Tyr-185, Thr-187, and both residues are shown for arrestin and no-arrestin conditions. Solid lines represent the model simulated trajectories, whereas the symbols show the experimental data used for model calibration.

