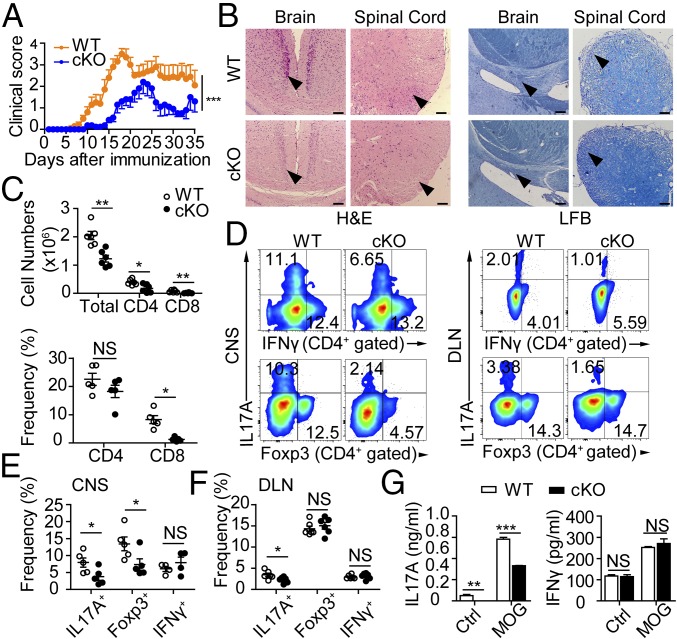
Fig. 2.
Loss of PP2A protects mice from EAE by repressing IL17A production. (A) Mean clinical scores for EAE from each group. (B) Representative histology of the brain and spinal cord [hematoxylin and eosin (H&E) at Left and luxol fast blue (LFB) at Right] of mice after EAE induction (day 19). Arrowheads indicate inflammatory infiltration (Left) and demyelination (Right). (Scale bars: 100 μm.) (C) Number and frequency of mononuclear cells or CD4+ or CD8+ T cells infiltrated into CNS. (D) Flow cytometry of IL17A, IFN-γ, and Foxp3 staining from CNS (Left) or DLN (Right) CD4+ T cells. (E and F) Quantification of IL17A+, IFNγ+, and Foxp3+ CD4+ T cells in CNS (E) or DLN (F). (G) Splenocytes were rechallenged with MOG peptide (5 μg/mL) or control vehicle for 3 d, and cytokine production was measured by ELISA. Each symbol represents an individual mouse (n = 4–6); error bars show mean ± SEM. Data are representative of three independent experiments with similar results. *P < 0.05; **P < 0.01; ***P < 0.001; NS, not significant.

