Fig. 1.
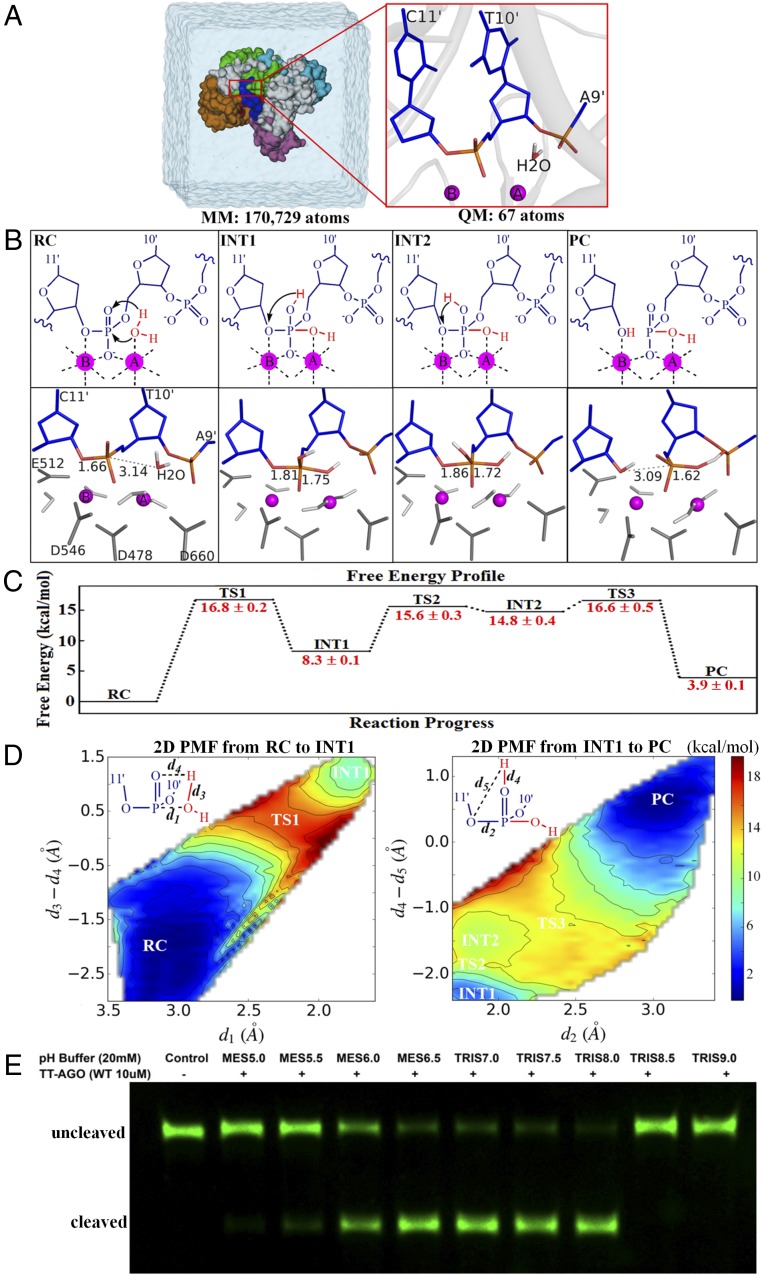
The substrate-assisted target DNA cleavage mechanism. (A) Overview of the setup used for our simulations for TtAgo-mediated target DNA cleavage. Snapshot of the simulation box (Left) and detailed view of the QM subsystem in the precleavage state (Right; PDB ID code 4NCB). (B) Detailed cleavage mechanism (Top) and respective critical structures (Bottom). Movies S1 and S2 show the mechanism details. The coordinating amino acid residues D546, D478, D660, and E512 are colored dark gray, and the coordinating waters that do not participate in the cleavage reaction are colored light gray. INT1, first intermediate; INT2, second intermediate; PC, product complex, i.e., postcleavage state; RC, reactant complex, i.e., precleavage state; TS1, first transition state; TS2, second transition state; TS3, third transition state. (C) Calculated free energy changes with their statistical errors along the reaction progress (in kilocalories per mole). Approximately 430 windows were selected to perform a total of approximately 6.5 ns B3LYP(6-31G*) QM/MM-MD simulations to generate the free energy profile. (D) Calculated 2D PMF along the reaction progress (in kilocalories per mole). The reaction coordinate d1 involves the nucleophilic attack of water to form a new P–O bond, reaction coordinate d3 − d4 is the hydrogen transfer from nucleophilic water to the pro-Rp phosphate oxygen of target nucleotide T10′, reaction coordinate d2 is the breaking of P–O bond between target nucleotides T10′ and C11′, and reaction coordinate d4 − d5 is the proton transfer from the pro-Rp oxygen of nucleotide T10′ to the 3′ leaving oxygen of target nucleotide C11′. (E) pH-dependent experimental measurements for the cleaved product of WT.

