Fig. 3.
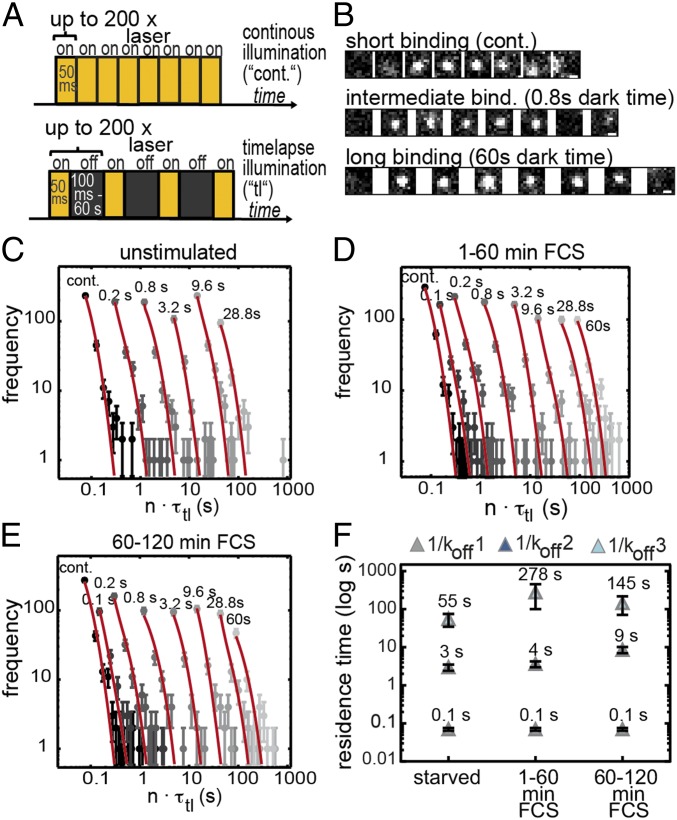
Halo-SRF residence time increases with cell stimulation in fibroblasts. (A) Illumination schemes for measuring residence times. Continuous illumination is depicted (Top). In addition, different dark times (black bars) ranging from 100 ms to 60 s were included between two 50-ms illuminations (Bottom). (B) Representative images showing single-molecule binding events for a short, intermediate, and long bound molecule. Dark times between two illuminated frames are indicated. (Scale bar: 500 nm.) (C–E) Histograms with fluorescent “on” times (gray circles) of (C) serum-starved cells (n = 1,409 bound molecules, n = 26 cells) or (D and E) FCS-stimulated cells for (D) 1 min to 60 min (n = 1,811 bound molecules, n = 61 cells) or (E) 60 min to 120 min (n = 1,308 bound molecules, n = 46 cells). The histograms were fitted globally with a three-component decay model to calculate average residence times of SRF (red; SI Appendix, Eq. III). Time-lapse times are indicated above the respective fit to the data points. Error bars indicate SD. (F) Computed average chromatin residence times for short (1/koff1, gray), intermediate (1/koff2, dark blue), and long bound (1/koff3, light blue) SRF molecules. Within 1 min to 60 min of serum stimulation (FCS), the average long residence time (dark-blue rectangle) increased fivefold, from 55 s to 278 s, and decreased to ∼145 s in the second hour of serum application. The average residence time for the intermediate fraction was unchanged at 1 min to 60 min of FCS stimulation, whereas it increased from 60 min to 120 min. Error bars indicate SD.

