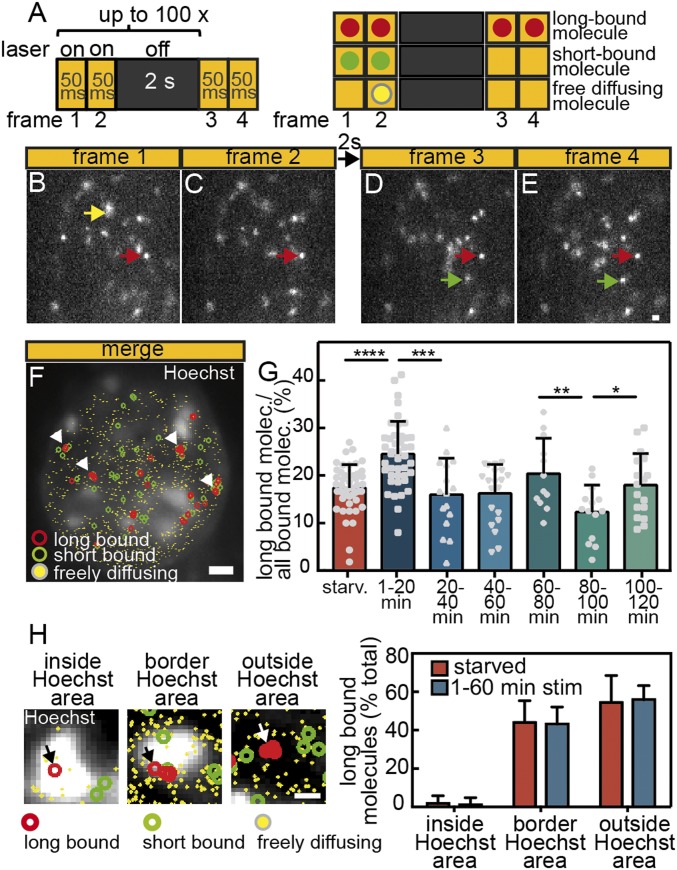
Fig. 4.
The fraction of long bound Halo-SRF molecules is enhanced by serum stimulation. (A) ITM illumination scheme. Molecules are tracked over repeated cycles of 2 × 50-ms exposures interspersed by 2 s of dark time (Left). Scheme illustrating different types of single-molecule events (Right). Long bound molecules (red dot) are present over ≥1 dark times, whereas short bound molecules (green dots) are only detectable over 2 × 50-ms illuminations. Freely diffusing molecules are detected in one frame only (yellow dot). (B–E) Representative examples of molecules imaged over four frames and one dark time interval. A freely diffusing molecule is present in frame 1 only (yellow arrow). A long binding molecule is present in all four frames (red arrows), whereas the short bound molecule (green) is present in frames 3 and 4 (green arrows). (Scale bar: 1 μm.) (F) All frames of an ITM movie were merged, and long bound, short bound, and freely diffusing molecules are highlighted by colors. The nucleus was counterstained with Hoechst to outline nuclear territories and borders, and binding events were overlaid. Arrows point at accumulations of long binding events. (Scale bar, 2 μm.) (G) NIH 3T3 cells expressing Halo-SRF were starved or stimulated for indicated time intervals with 10% FCS. During stimulation, the fraction of long bound molecules showed a periodic behavior peaking at 1 min to 20 min, 60 min to 80 min, and 100 min to 120 min after FCS addition (mean ± SD; *P ≤ 0.05; **P ≤ 0.01; ***P ≤ 0.001; ****P ≤ 0.0001; t test). Each gray circle, square, or triangle indicates one cell analyzed (starved: n = 47 cells; 1 min to 20 min: n = 43 cells; 20 min to 40 min: n = 16 cells; 40 min to 60 min: n = 20 cells; 60 min to 80 min: n = 12 cells; 80 min to 100 min: n = 14 cells; 100 min to 120 min: n = 17 cells). (H) Costaining of nuclei for Halo-tagged SRF molecules (red circles) and Hoechst (white signals). Example of long bound SRF molecule (arrow) present inside the white Hoechst-positive area (Left), at the border (Center Left) or outside the Hoechst signal (Center Right). (Right) Quantification shows localization of SRF molecules almost exclusively outside the Hoechst area or at the border but rarely inside the Hoechst-positive area. No differences were observed in starved or stimulated cells (starved: n = 5 cells; 1 min to 60 min FCS: n = 12 cells). (Scale bar, 400 nm.)

