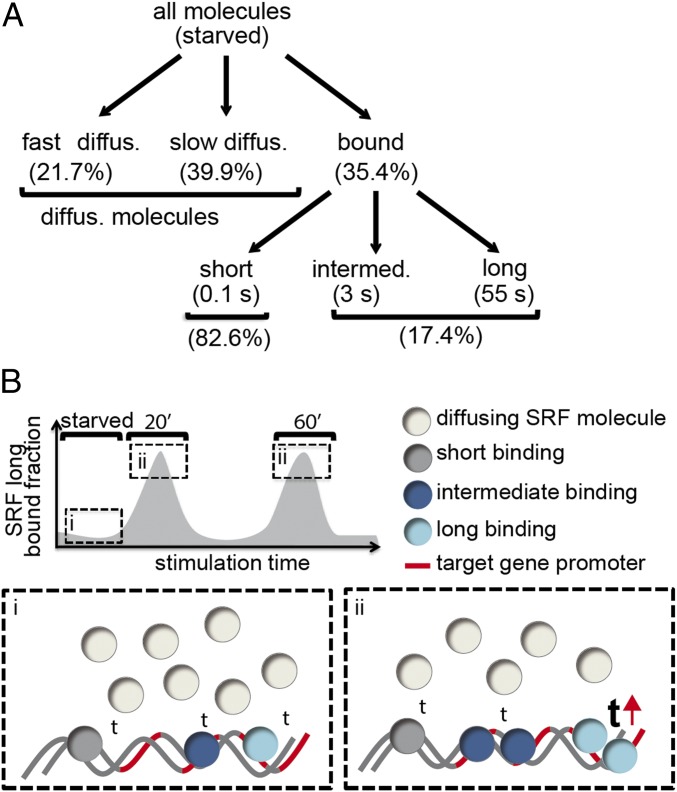
Fig. 7.
Summary scheme. (A) Scheme depicting segregation of all SRF fractions in starved fibroblast cells. (B) Scheme depicting changes in residence time (“t”) and long bound fraction of SRF molecules in unstimulated (i) and stimulated (ii) cells. After stimulation, the residence time of the long bound fraction increased (see upward-directed red arrow).

