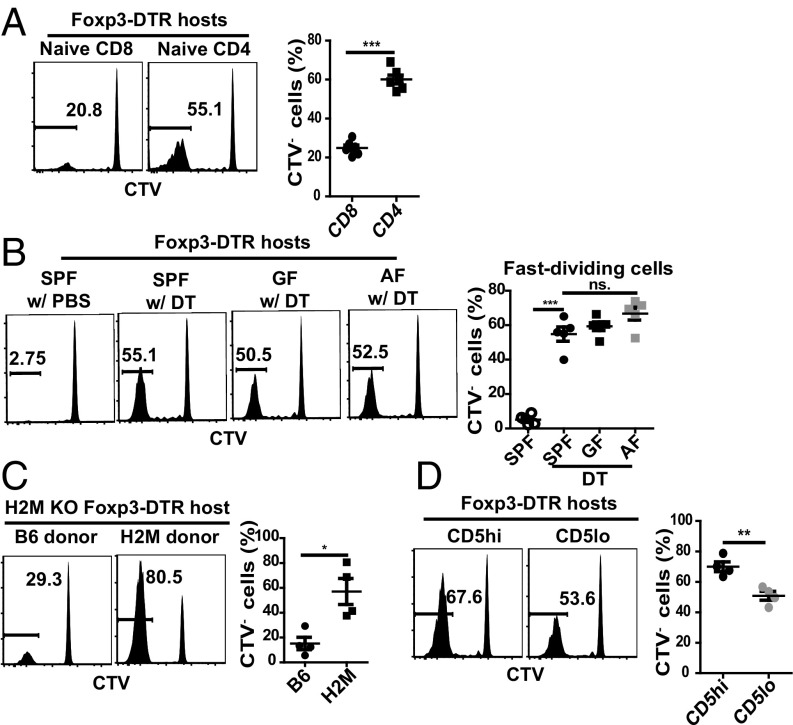
Fig. 2.
Preferential proliferation of CD4 T cells with high TCR affinity for self-pMHC following Treg depletion. (A and B) Comparison of donor T cell proliferation at day 7 postinjection in Foxp3-DTR hosts adoptively transferred with 2 × 10⁶ purified CTV-labeled CD44lo CD62Lhi naive CD4 or CD8 T cells from CD45.1 Foxp3-GFP mice, followed 1 d later by DT injection. (A) Representative FACS plots for proliferation and graphs of percent fast-dividing cells for donor CD4 or CD8 T cells in SPF Foxp3-DTR hosts (n = 4 per each group). (B) Representative FACS plots for proliferation and graph of percent fast-dividing donor CD4 T cells in SPF, GF, or AF Foxp3-DTR hosts (n = 5 per each group). (C) H2m−/−Foxp3-DTR hosts adoptively transferred with 2 × 10⁶ CD44lo CD62Lhi naive CD4 T cells purified from WT or H2m−/− Foxp3-GFP mice followed by DT injection as in A and B. Shown are representative FACS plots for proliferation and graph of percent fast-dividing donor T cells at day 10 following Treg depletion (n = 4). (D) Representative CTV dilution profile of donor T cells and graph of percent fast-dividing donor T cells at day 7 postinjection in Foxp3-DTR hosts adoptively transferred with 2 × 10⁶ CD5hi or CD5lo CD44lo CD62Lhi naive CD4 T cells from Foxp3-GFP mice followed 1 d later by DT injection as in A and B; upper 25% or lower 25% of naive CD4 T cells were isolated based on their CD5 expression. Shown are representative FACS plots for proliferation and graph of percent fast-dividing donor T cells (n = 4 per each group). P values were determined by Student’s t test or by one-way ANOVA with Newman–Keuls multiple-comparison test. Error bars show mean ± SEM. *P < 0.05; **P < 0.01; ***P < 0.001.

