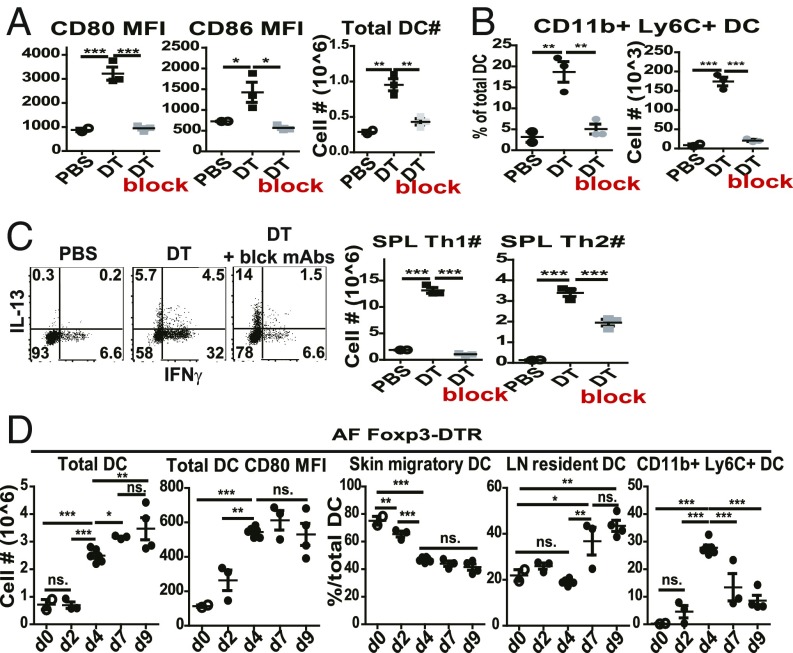
Fig. 3.
DCs undergo progressive phenotypic changes following acute Treg depletion. (A–C) Foxp3-DTR mice were treated with PBS (n = 2), DT (n = 3), or DT plus a mixture of neutralizing mAbs against TNFα, CD40L, and ICOSL (block) (n = 3) and assayed 1 wk later. (A) Mean fluorescence intensity (MFI) of CD80/86 on PLN DCs (Left). Total numbers of PLN DCs (Right). (B) Percentages of CD11b+ Ly6C+ cells among PLN DCs and total numbers of PLN CD11b+ Ly6C+ DCs. (C) Representative FACS plots for IFNγ and IL-13 production by splenic CD4 T cells after 4 h of ex vivo restimulation in the presence of PMA/ionomycin and protein transport inhibitors (Left), and total numbers of Th1 or Th2 cells (Right). (D) PLN DC activation kinetics at day 0 (n = 2), day 2 (n = 3), day 4 (n = 6), day 7 (n = 3), and day 9 (n = 4) following DT injection of AF Foxp3-DTR mice. Numbers of total PLN DCs, MFI of CD80 on total PLN DCs, and percent graphs of skin migratory DCs, LN-resident DCs, or CD11b+ Ly6C+ DCs among total PLN DCs. Gating on TCRβ− B220− Thy1.2− NK1.1− Ly6C− cells, MHCIIhi CD11cint cells were defined as skin migratory DCs, and MHCIIint CD11chi cells as LN-resident DCs. P values were determined by one-way ANOVA with Newman–Keuls multiple-comparison test. Error bars show mean ± SEM. *P < 0.05; **P < 0.01; ***P < 0.001.

