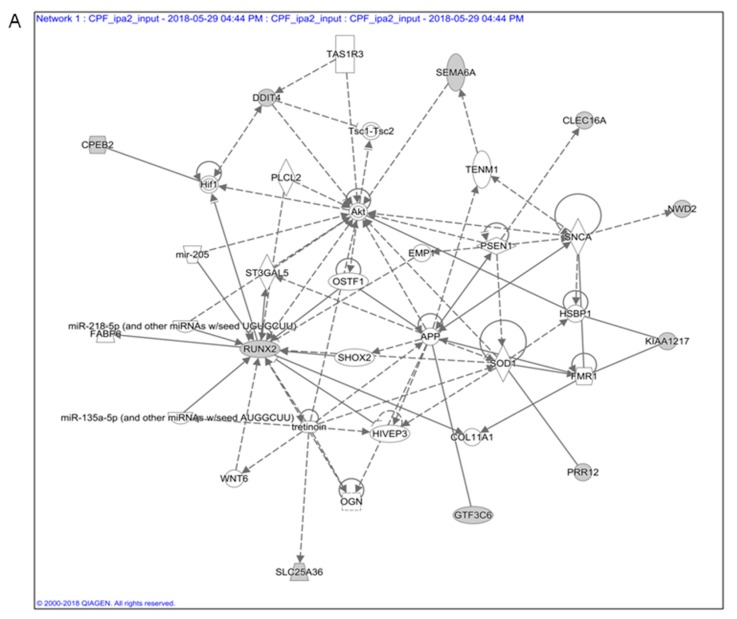
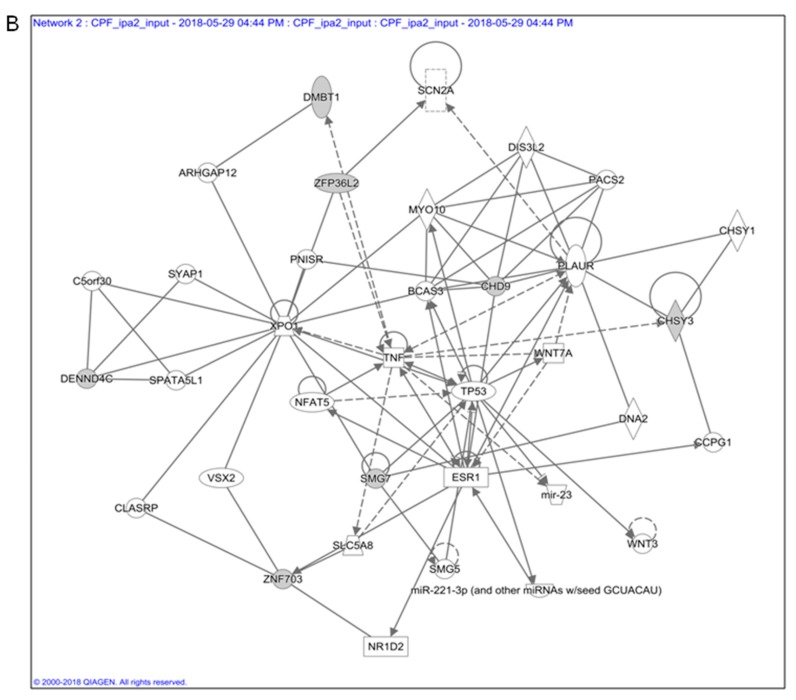
Figure 1.
Network built up with the genes included in the endodermal carcinogenic gene signature (ECGS) derived from ToxoFunctions identified by Ingenuity Pathway Analysis (IPA) analyses. The differentially regulated genes (grey nodes) mapped to pathway annotations derived from literature and gene ontology using Ingenuity Pathway Analysis (IPA)). The solid lines connecting molecules represents a direct relation and dotted lines an indirect relation. IPA constructs networks that optimize for both interconnectivity and number of Focus Genes (the grey nodes) under the constraint of a maximal network size. White nodes are added by the algorithm to build a highly connected molecular network between Focus Genes.


