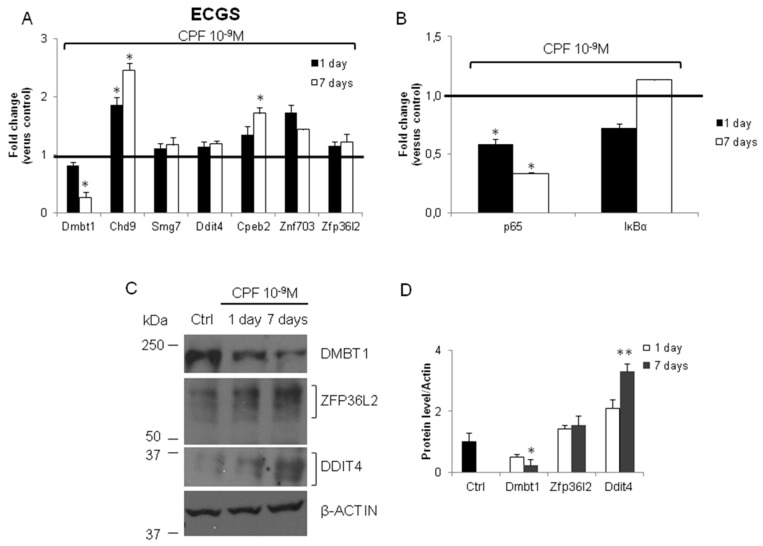
Figure 6.
Chlorpyrifos exposure regulates the expression in FRTL-5 in time-dependent manner of ECGS transcript. FRTL-5 cells were exposed to CPF 10−9 M for 1 or 7 days or vehicle only (DMSO). RT-qPCR was performed as detailed in Materials and Methods and primers are listed in Table S1. (A) ECGS transcripts levels in control and CPF 10−9 M treated cells. (B) p65 and IĸBα mRNAs were determined by RT-qPCR in the same samples. Western blotting (C) and densitometry analysis (D) of DMBT1, ZFP36L2 and DDIT4 protein in FRTL-5 untreated (Ctrl) and exposed to 10−9 M CPF for 1 and 7 days. β-Tubulin was used as loading control. RT-qPCR data are reported as fold change values calculated as ratio between average relative gene expression in treated and control cells. Data are reported as the average and standard deviation of Gapdh-normalized mRNA levels. The black bar signs the control level. Results are expressed as the mean ± standard deviation of three independent experiments. (Dmbt1 p-value = 0.049, Chd9 p = 0.021, p = 0.032; Cpeb2 p = 0.020).

