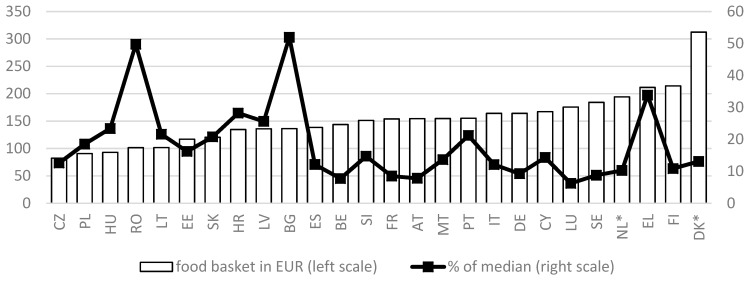
Figure 2.
Total food baskets for a single woman in EUR / month (left axis) and as a percentage of the national median equivalent disposable household income (right axis). Results refer to the capital city of each country. Prices 2015. * Pricing procedure for DK and NL is not fully comparable. Source: [26] and Eurostat online database (median income).

