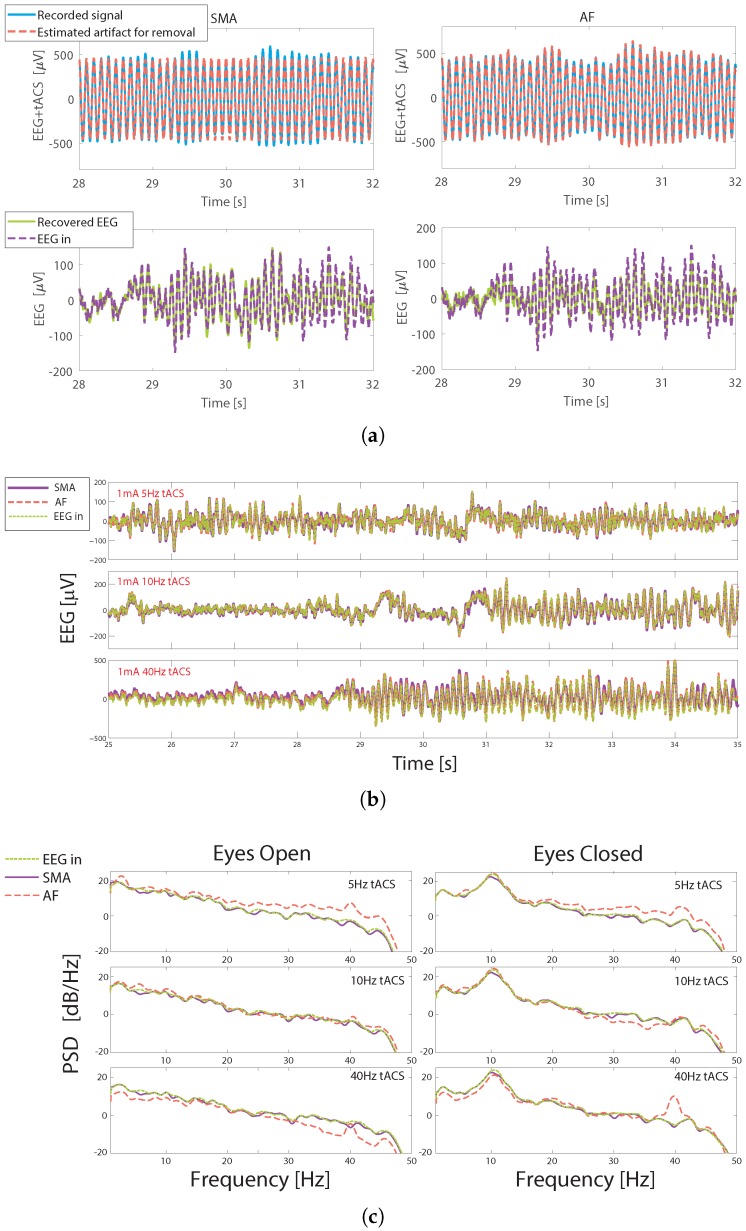
Figure 6.
Illustrations of artifact removal from the phantom head. (a) The raw recorded signals and the artifacts which are estimated from these by the two algorithms. The recovered EEG signal compared to the one inputted to the phantom head is also shown. Traces are for a 10 Hz, 0.25 mA stimulation. (b) Example reconstructions for different tACS frequencies. All stimulation amplitudes are 1 mA. For both the SMA and AF approaches the recovered EEG signal visually closely matches that which is inputted into the head model. (c) Frequency domain representation. PSD at 0.25 mA stimulation, with the inputted EEG data split into eyes open and eyes closed periods.

