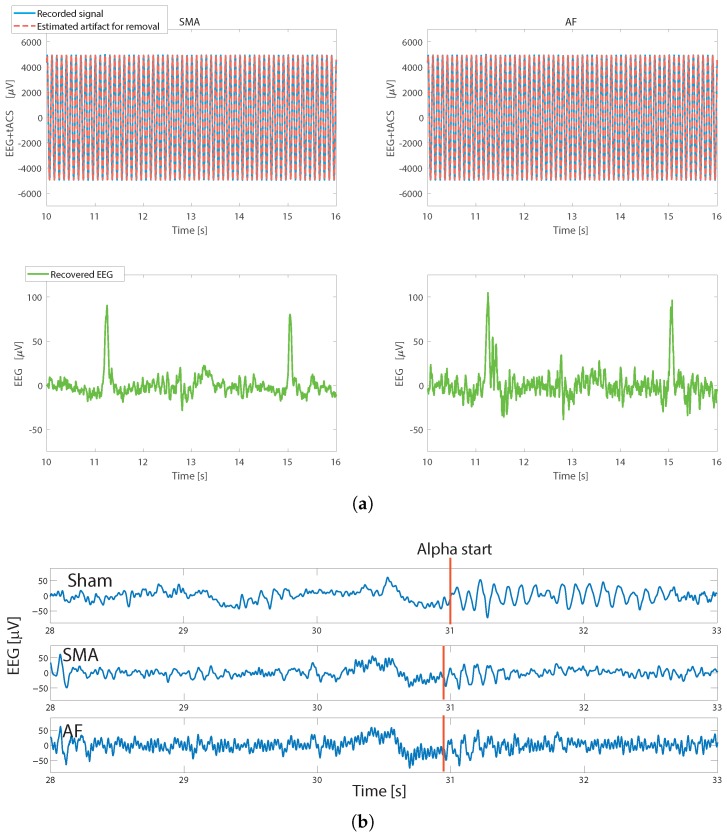
Figure 8.
Time domain EEG after artifact removal. (a) The measured artifacts using the two algorithms and the recovered EEG during an eye blink. 10 Hz, 0.25 mA stimulation. (b) EEG data during the alpha task protocol, at PO8, for a single subject showing sham and artifact removed data with tACS at 40 Hz, 1 mA amplitude. Eyes are closed at the 30 s mark. Then bursts of alpha are seen for both sham and stimulation using all three artifact removal approaches. Note that the sham and stimulation are different trial runs and thus the EEG trace for sham and the other figures are not expected to be identical.

