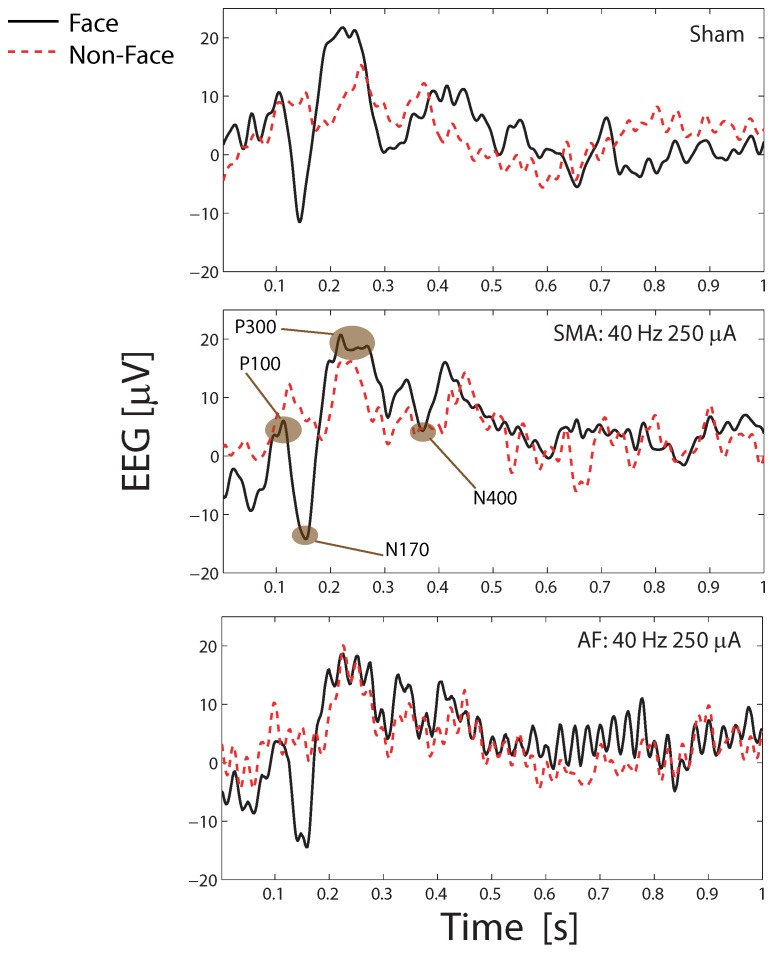
Figure 10.
Average ERP at PO8 after application of the detection algorithm for sham and stimulation, at 40 Hz 250 A stimulation in a single subject. All peaks are detected at the expected times and the expected increases in N170 and N400 depths are seen when face stimuli are presented. Note that the sham and stimulation are different protocols and thus the EEG trace for sham and the other figures are not expected to be identical.

