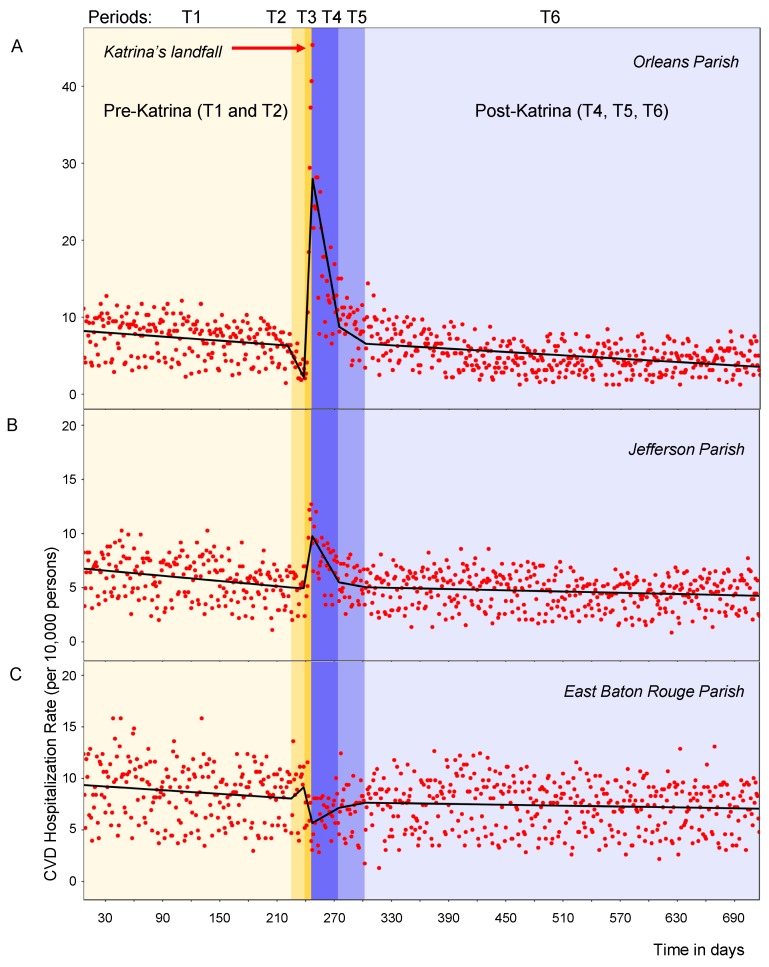
Figure 3.
Time series of daily CVD hospitalization rates per 10,000 elderly adults with superimposed predicted values for 7 January 2005–17 December 2006 in Orleans Parish (Panel A), Jefferson Parish (Panel B), and East Baton Rouge Parish (Panel C). Actual daily hospitalization rates are displayed as points; rates predicted by a piecewise regression model are displayed as lines. The different hues and capital letters indicate the six distinct time periods with landfall occurred on 29 August 2005 right after day 240, at the border between T2 and T3 periods.

