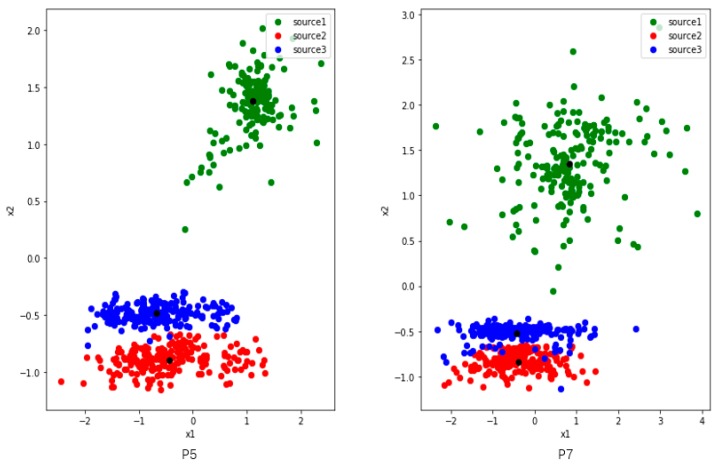
Figure 5.
The distribution of three activities features which are collected from users P5 (left) and P7 (right) in UCI. The distributions of the two users are very similar. The red and blue points are close to each other, while the green one is dispersed and away from them. The black points are the centers of the three classes of features.

