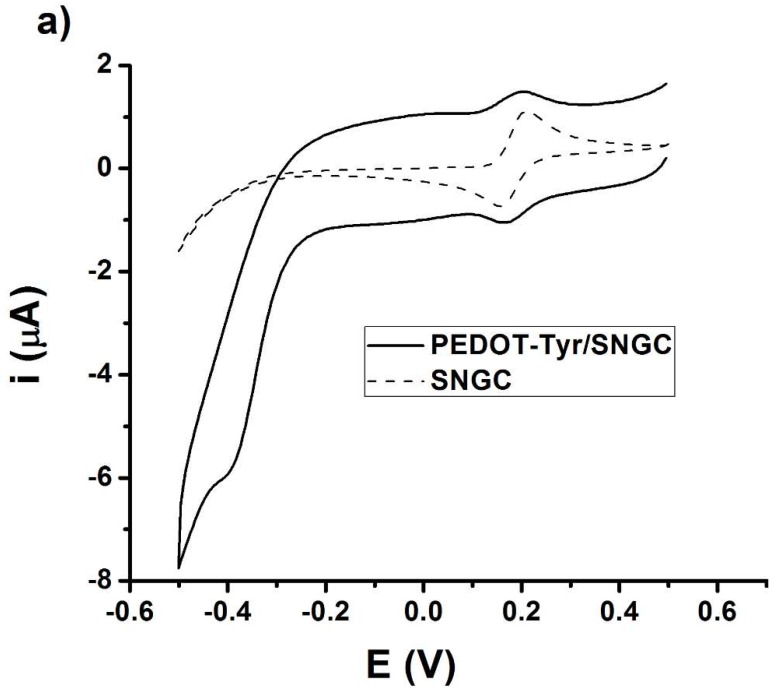
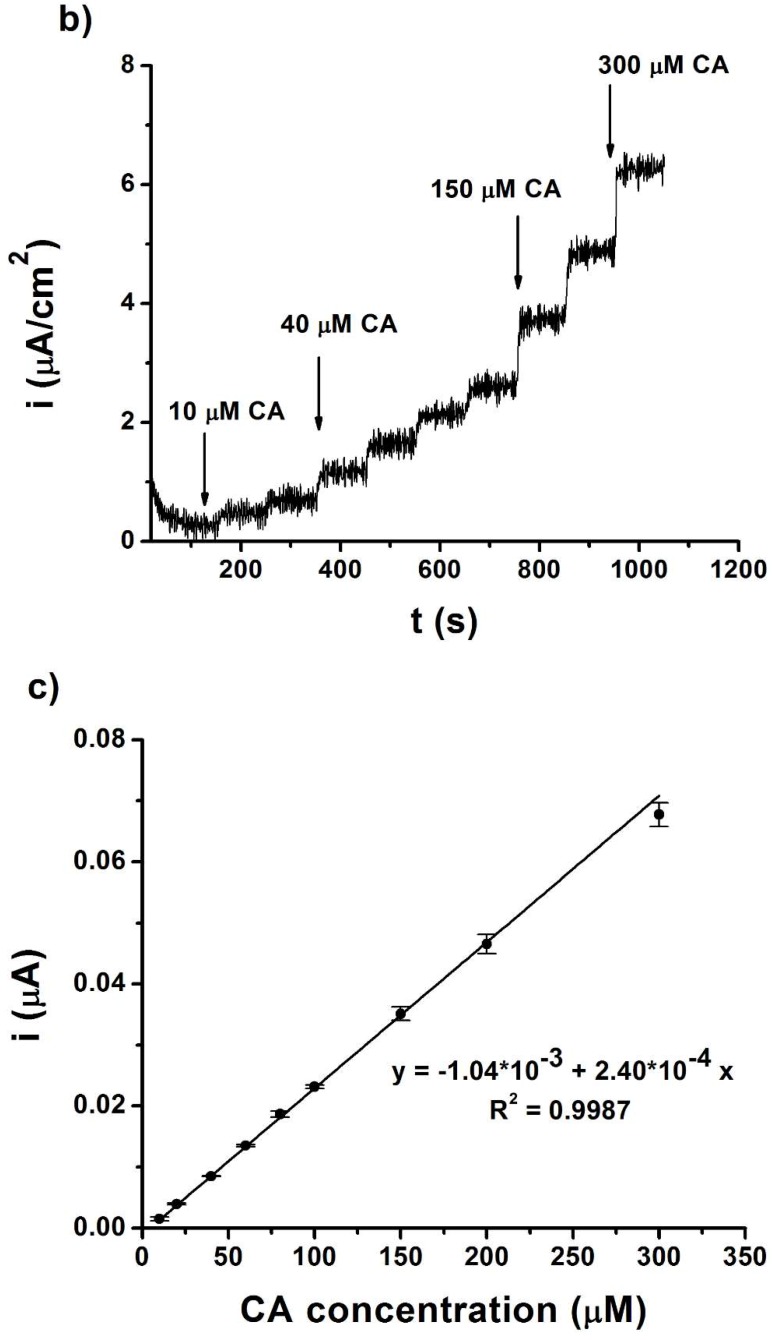
Figure 2.
(a) Cyclic voltammograms recorded at SNGC and PEDOT-Tyr-SNGC electrodes in a 0.1 M phosphate buffer aqueous solution containing 300 µM caffeic acid, at 50 mV/s potential scan rate; (b) Chronoamperogram corresponding to caffeic acid additions (10, 20, 40, 60, 80, 100, 150, 200, and 300 µM) at the PEDOT-Tyr/SNGC biosensor; (c) calibration plot with error bars expressed as standard deviation.


