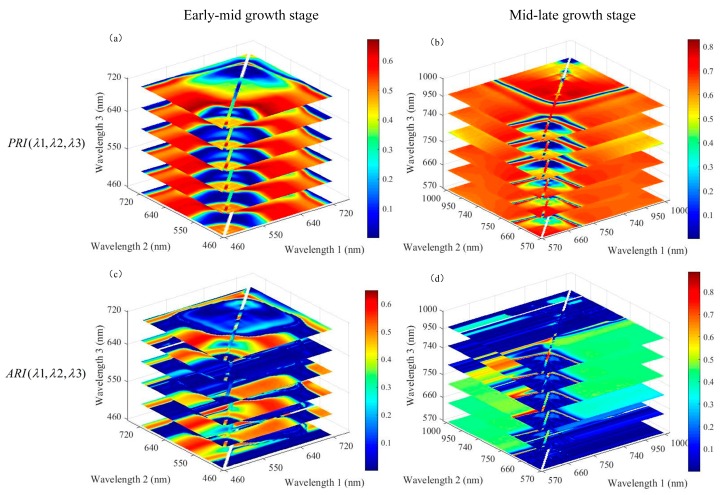
Figure 4.
Three-dimensional slice maps of the correlation coefficients (R2) for the relationships between the yellow rust disease index and the new indices calculated from all possible three-band combinations at 3 nm band sampling intervals from the wavelengths sensitive in the different growth stages. (a) and (b) R2 of PRI (λ1, λ2, λ3) (Photochemical Reflectance Index) at the early-mid and mid-late growth stages, respectively; (c) and (d) R2 of ARI (λ1, λ2, λ3) (Anthocyanin Reflectance Index) at the early-mid and mid-late growth stages, respectively; λ1, λ2, and λ3 are the wavelengths sensitive to yellow rust discrimination.

