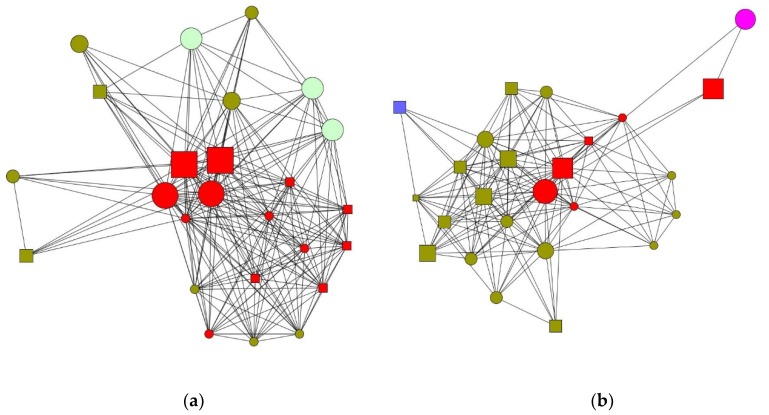
Figure 1.
(a,b) Women are depicted as circles and men as squares. The size of the nodes shows place of residence, with a larger size depicting greater geographical proximity. Type of relationship is indicated by colors, with red indicating direct relatives; olive green, friends; light green, neighbors; blue, work colleagues; and pink, external help. Graphs depicting the personal networks of female and male caregivers.

