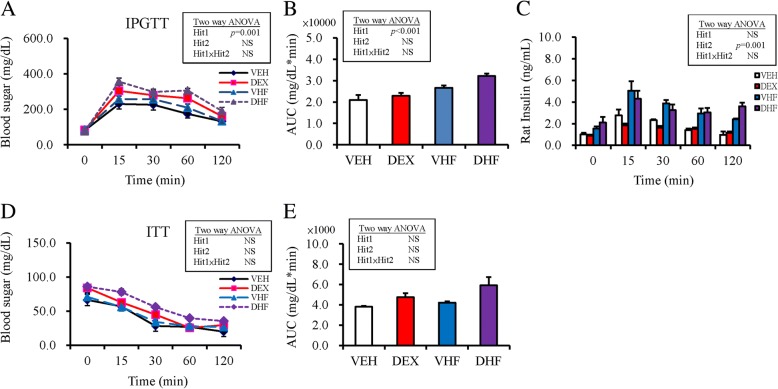
Fig. 1.
Blood glucose levels in post-stimulation tests. (a) Intraperitoneal glucose tolerance test (IPGTT); (b) Glucose area under the curve (AUC) of IPGTT; (c) plasma insulin level; (d) insulin tolerance test (ITT); and (e) AUC of ITT in the four experimental groups. Results were analyzed using two-way ANOVA (prenatal dexamethasone exposure × postnatal HF diet). All values are presented as the mean ± standard error (n = 8). *P < 0.05. VEH, normal diet; DEX, prenatal dexamethasone exposure; VHF, postnatal HF diet; DHF, prenatal dexamethasone plus postnatal HF diet

